
A SaaS financial model in Excel is a dynamic, driver-based tool designed to forecast recurring revenue, manage cash burn, project AI compute expenses, and structure core financial statements from scratch. Building an investor-ready model requires setting up clean input drivers, forecasting monthly subscriber cohorts, and linking operational assumptions to the Income Statement, Cash Flow Statement, and Balance Sheet. While founders can structure an initial forecast independently, leveraging an expert FP&A framework ensures your financial logic holds up under investor due diligence. At Excel Business Resource, having built custom models for over 100+ startups globally, we designed this step-by-step guide to help you build a robust financial forecast.
What Is a SaaS Financial Model and Why Do Startups Need One?
A SaaS financial model is not just a budget spreadsheet for tracking past expenses. It serves as an operational roadmap and financial projection engine for decision-making. Founders use financial models to understand capital requirements, evaluate pricing models, test hiring plans, and demonstrate growth velocity to investors.
SaaS Financial Model Core Objectives
Revenue Predictability |
Track MRR, ARR, and Subscriber Cohorts |
Capital Efficiency |
Measure Net Burn Rate & Cash Runway |
Analyze LTV:CAC Ratios & Payback | |
Investor Readiness |
Deliver Audited 3-Statement Outputs |
When raising seed or Series A capital, venture capitalists expect a model that dynamically links operating drivers directly to your Income Statement, Cash Flow Statement, and Balance Sheet.
Founder’s Note: Essential Rules for Building Your SaaS Excel Model
When building or auditing your SaaS financial model, always keep these fundamental rules in mind:
Keep It Clean & Readable: Both founders and investors should be able to understand your business logic without fighting through complex or nested formulas.
Standardize Color Formatting: Maintain strict visual clarity by using readable Yellow Cells/ Orange Cell for manual input variables and black text for calculated formulas so editable cells are instantly clear.
Centralize Master Assumptions: Compile all key drivers into a single Master Assumptions / Input Drivers tab. Never hardcode numbers inside financial statement formulas.
Structure into Modular Sub-Tabs: Logically separate your model into distinct tabs (Acquisition, Revenue Cohorts, COGS, OpEx, 3-Statements) to avoid formula errors.
Identify SaaS-Critical Drivers: Critically isolate variables like organic vs. paid conversion rates, monthly churn, pricing tiers, credit pack usage, and AI token compute expenses to ensure an accurate forecast of your MRR growth and cash runway.
What Are the Essential Tabs Required in a SaaS Financial Model?
A well-structured spreadsheet uses modular tabs to prevent broken formulas and simplify navigation for external auditors.
| Tabs In Excel | Purpose |
|---|---|
1. Cover & ToC |
Version Control, Navigation & Color Codes |
2. Input Drivers |
Global Assumptions, Users Segments, Marketing Budgets, OpEx, CapEx, Investment & Debt Schedules |
3. Customer Acquisition |
Marketing Budget, Traffic & Conversion |
4. Revenue & COGS |
MRR Cohorts, Churn & AI Token Costs |
5. Headcount & OpEx |
Hiring Plan, Salaries & Department Costs |
6. Core Statements |
Income Statement, Cash Flow, Balance Sheet |
7. Dashboard & Summary |
Visual Charts, Key Metrics & Scenarios |
1. Cover & Model Instructions Tab
Establish clear modeling standards. Use blue text for manual input cells, black text for dynamic formulas, and green text for external sheet references.
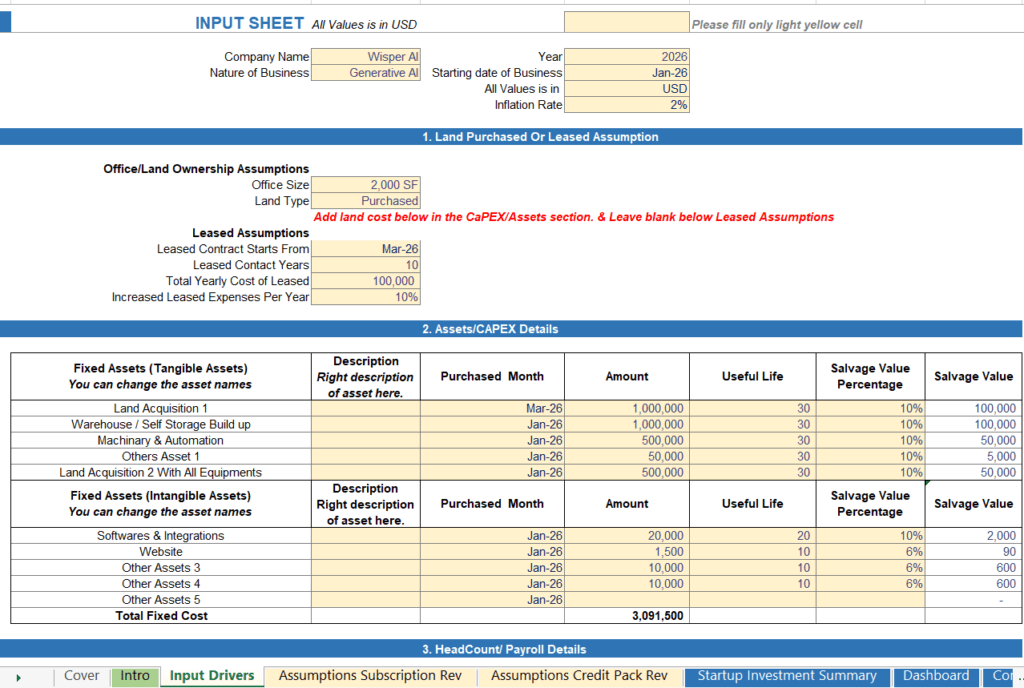
2. Global Input Drivers Tab
Centralize your starting assumptions including launch date, reporting currency, corporate tax rates, inflation, initial cash balance, capital expenditures (CapEx), and debt amortization. Learn how to isolate core variables in our guide to business drivers for startups.
3. Customer Acquisition & Marketing Funnel Tab
Map out paid ad channels, organic search traffic, conversion rates, cost per click (CPC), and lead conversion pipelines.

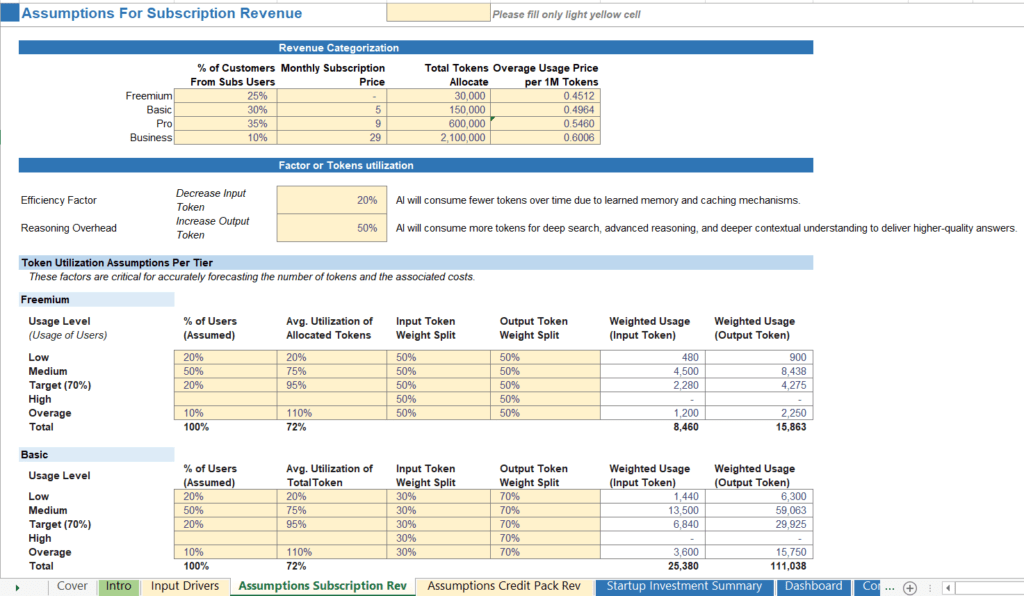
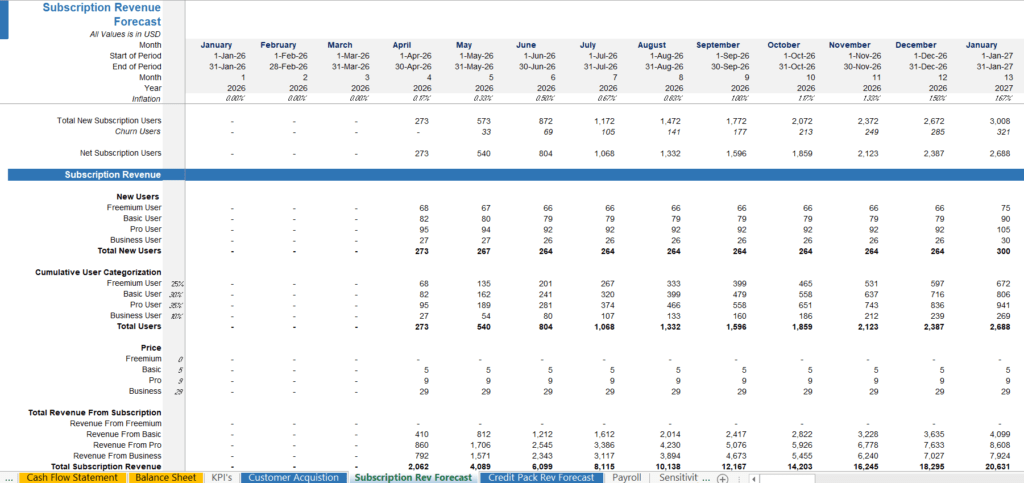
4. Subscription Revenue & Direct COGS Tab
Structure your recurring subscription tiers, churn rates, add-on credit packs, hosting costs, and variable third-party API token expenses.
5. Headcount & Operating Expenses (OpEx) Tab
List team hiring dates by department (Engineering, Sales, Marketing, G&A), base salaries, annual merit raises, and payroll tax overheads.

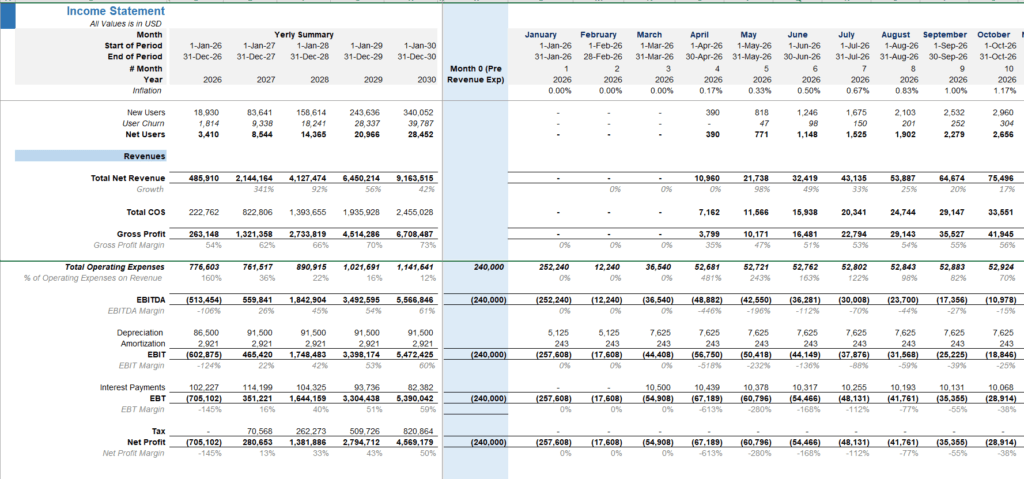
6. Three Core Financial Statements
Link your operational drivers directly into an automated Income Statement (P&L), Cash Flow Statement (Operating, Investing, Financing), and balanced Balance Sheet.


The 4-Step Process: Building Your SaaS Forecasting Model in Excel
Building a SaaS financial model from scratch requires translating raw operational assumptions into dynamic Excel formulas. To ensure your spreadsheet remains easy to audit and flexible for scenario planning, we break the modeling process into four core sequential steps. By following this execution workflow, founders can systematically connect customer acquisition pipelines to revenue cohorts, variable AI compute expenses, and cash runway outputs.
Step 1: How to Build a Customer Acquisition & Growth Funnel in Excel?
Every financial model starts with customer acquisition assumptions. Rather than guessing subscriber numbers, build a funnel driven by marketing spend and traffic conversions.
See the above sub heading i.e. customer acquisition tab, that is a great demonstration of formatting of user acquisition forecast working.
- Monthly Ad Spend / Cost Per Click (CPC) = Paid Website Visitors
- Organic Traffic + Paid Visitors = Total Monthly Visitors
- Total Visitors * Lead Conversion Rate = Product Signups / Free Trials
- Free Trials * Paid Conversion Rate = New Subscribers Acquired
To keep your acquisition pipeline dynamic, avoid hardcoding user growth. Use driver-based forecasting so your user growth scales automatically whenever you increase marketing budgets.
Step 2: How to Forecast SaaS Revenue, MRR, and Subscriber Churn?
SaaS revenue forecasting requires tracking active subscriber cohorts month over month. Because subscription revenue compounds over time, your formulas must handle additions, upgrades, downgrades, and cancellations.
Monthly Revenue Forecast Logic:
Beginning Subscribers (Month N)
+ New Subscribers Acquired
+ Upgraded Subscribers (Expansion)
– Downgraded Subscribers (Contraction)
– Canceled Subscribers (Churn)
= Ending Subscribers (Month N)
1. Monthly Recurring Revenue (MRR) Component Breakdown
Track your monthly revenue using four dynamic buckets:
- New MRR: Revenue generated from newly onboarded subscribers.
- Expansion MRR: Additional revenue from upgrades or add-on features.
- Contraction MRR: Reduced revenue from plan downgrades.
- Churned MRR: Total lost revenue from customer cancellations.
For detailed Excel formulas on building subscription cohorts, review our dedicated guide on how to forecast saas revenue.
2. How Does Monthly Churn Impact Multi-Year Forecasts?
Subscriber churn is the single biggest threat to compounding SaaS revenue. Even a modest 5% monthly customer churn rate erodes nearly half your customer base in a single year. Always make churn rate a flexible driver so you can stress test worst-case retention scenarios.
Step 3: How to Model AI Compute Costs and Token Economics in SaaS COGS?
Traditional SaaS applications enjoy high gross margins (75% to 85%) because server hosting costs per user are minimal. However, modern Generative AI and Agentic AI startups face significant variable compute costs for every user query.
Failing to forecast token usage is a major reason AI startups run out of capital unexpectedly.
AI SaaS COGS Calculation Engine:
Monthly Active Users * Average Queries per Month = Total Monthly Queries
Input Tokens per Query * Cost per 1M Tokens = Total Input API Cost
Output Tokens per Query * Cost per 1M Tokens = Total Output API Cost
Total API Costs + Hosting Infrastructure = Total Monthly COGS
1. Input vs. Output Token Pricing Integration
AI model providers (such as OpenAI, Anthropic, or open-source models on AWS/RunPod) charge separately for prompt inputs and text/reasoning outputs. Input tokens are generally cheaper than generated output tokens.
To build an accurate COGS schedule for an AI SaaS startup:
- Estimate average monthly queries per active subscriber.
- Define average Input Tokens per query (e.g., 500 tokens).
- Define average Output Tokens per query (e.g., 1,500 tokens).
- Multiply token volumes by provider pricing per 1,000,000 tokens.
- Include a YoY cost efficiency factor to model falling LLM compute prices and prompt caching.
2. Hybrid Pricing Models: Subscriptions + Credit Packs
Many AI tools offer a baseline subscription tier alongside pay-as-you-go credit top-ups. Your model must isolate recurring subscription revenue from one-time credit pack purchases. If you are building a GenAI product, skip coding complex token formulas by downloading our pre-built AI SaaS Startups (Gen AI Or Agentic AI) Financial Plan.
Step 4: How to Track Cash Burn Rate and Forecast Cash Runway?
Managing liquidity is critical for startup survival. Your financial model must tell you exactly how many months of operations remain before you require additional funding.
Gross Burn Rate = Total Monthly Cash Outflows (OpEx + Direct COGS)
Net Burn Rate = Operating Expenses – Monthly Cash Collections
Cash Runway (Months) = Available Cash Balance / Net Monthly Burn Rate
Your model should feature automated alerts whenever cash runway drops below six months. For an instant health check of your liquidity, download our free burn rate template or cash runway template.
How to Link Core SaaS Metrics & Valuation Outputs?
While operational sheets handle daily inputs, your executive dashboard should display high-level SaaS efficiency metrics and startup valuation outputs.
Rather than cluttering your core forecasting tabs with complex theoretical formulas, link your metrics to specialized guides:
- Unit Economics & LTV:CAC Ratios: Benchmark your acquisition efficiency using our guide to unit economics.
- SaaS Pricing Structures: Evaluate subscription tiers vs usage billing using our guide to understand SaaS pricing model.
- Company Valuation Multiples: Estimate company worth using industry-standard startup valuation methods and proven EBITDA Multiple valuation.
Step-by-Step Checklist For Building SaaS Model in Excel:
Follow this practical checklist to ensure your financial model is complete, accurate, and investor-ready:
Set Up Central Drivers:
Define launch dates, currency, tax rates, and starting cash in blue font cells.Build Traffic Funnels:
Link ad spend to web visitors, trial signups, and paid subscriber conversions.Model Subscription Cohorts:
Calculate New, Expansion, Contraction, and Churned MRR on a monthly schedule.Calculate Direct COGS:
Factor in cloud hosting, customer support, and API token compute expenses.Detail Salary Schedules:
List hiring dates, base salaries, and payroll taxes across all departments.Automate 3-Statement Linking:
Flow Net Income into Cash Flow, and dynamically balance Assets and Liabilities.Create Visual Dashboards:
Display MRR growth charts, net burn rate curves, and cash runway alerts.Perform Stress Tests:
Run sensitivity analysis on churn rate spikes and rising customer acquisition costs.
Why Founders Should Seek Professional Help for Financial Modeling
Building an initial draft in Excel helps founders understand their business mechanics. However, presenting a self-built model to venture capital firms or institutional lenders carries significant risk.
Self Built Model Vs Expert FP&A Model
| Self-Built Model | Professional FP&A Model |
|---|---|
Risk of hidden circular reference errors |
Fully audited 3-statement logic |
Unrealistic margin assumptions |
Sector-aligned industry benchmarks |
Vulnerable during VC due diligence |
Defense-ready scenario testing |
Financial models are essential strategic assets used for key business decisions and raising capital. Investors examine your model to judge your operational rigor. A single broken link, circular error, or unrealistic margin assumption can ruin your credibility during investor meetings.
Working with an experienced financial specialist ensures your financial statements balance perfectly, your unit economics hold up under questioning, and your valuation reflects current market benchmarks.
Download Investor-Ready Financial Model Templates
Avoid formula errors and streamline your fundraising process with our pre-built, fully dynamic Excel templates:
- Explore EBR’s SaaS Or Tech Financial Model Templates
- For Generative & Agentic AI Startups: Download our specialized AI SaaS Startups Financial Model.
- For B2B Software Businesses: Download our comprehensive Enterprise B2B SaaS Financial Forecasting Model.
- For Mobile Applications: Get our ready-to-use Mobile App Financial Model.
- Other Industry Specigic Startups: Explore our entire library of Startup Financial Projection Model Templates.
Need custom financial modeling, pitch deck support, or valuation advisory? Learn how an experienced FP&A consultant can help scale your startup or contact our team at Excel Business Resource today.
Frequently Asked Questions (FAQs)
What is the ideal cash runway for a SaaS startup?
Early-stage SaaS startups should maintain between 18 and 24 months of cash runway. This gives your team sufficient operational time to hit key ARR milestones before initiating your next fundraising round.
How many years should a SaaS financial model project?
Investors typically expect a 3 to 5-year financial forecast. Years 1 and 2 should be modeled on a detailed monthly basis, while Years 3 through 5 can transition into annual summaries.
What is the difference between a general financial model and a SaaS model?
General models track one-time product sales and inventory turnover. SaaS models track recurring subscription revenue (MRR/ARR), subscriber retention cohorts, monthly churn rates, and continuous customer acquisition budgets.
Why do AI SaaS startups require custom COGS modeling?
Unlike traditional software with fixed hosting overhead, AI SaaS apps incur variable API token costs for every user prompt. Modeling input and output tokens per query is essential to protect long-term gross margins.