Why Biotech Revenue Forecasting Is Unlike Any Other Industry
Ask a SaaS founder how they forecast revenue, and they will point to monthly recurring revenue, churn rate, and customer acquisition cost. Ask a retail CFO, and they will reference same-store sales and inventory turns. Now ask a biotech founder — and the entire framework changes completely.
Biotech revenue forecasting operates on a fundamentally different plane of financial risk and time horizon. A therapeutic startup or its product entering in Phase I clinical trials today may not generate a single dollar of revenue for seven to twelve years. The U.S. Food and Drug Administration (FDA) approves less than 12% of drug startups or its product that enter clinical trials. Every pipeline asset carries binary risk: it either advances or it fails, and a single Phase III failure can erase hundreds of millions in projected value overnight.
This is precisely why an accurate, probability-weighted financial model is not a luxury for a biotech startup — it is a survival kit. Venture Capitalists doesn’t want to see optimistic peak sales projections when they are evaluating a Series A or Series B round . They want to see a disciplined model that accounts for realistic clinical attrition, regulatory timelines, patent expiry windows, and multiple revenue pathways so they can analyze their profitability & returns. Without rigorous biotech startup forecasting model, fundraising conversations stall or end entirely.
This guide walks you through the exact methodology, input drivers, and forecast structure that professional biotech financial modelers use so you understand every assumption, build it correctly, and present it with confidence to investors.
The Foundation: What Input Drivers Actually Drive Your Forecast
Before building a single revenue projection, you must establish your input driver sheet — the master assumption layer that feeds every downstream financial output. This is where most biotech founders make their first critical mistake: they either skip formal assumptions entirely, or they hard-code numbers without a structured framework that investors can audit.
A properly structured input driver sheet covers five domains:
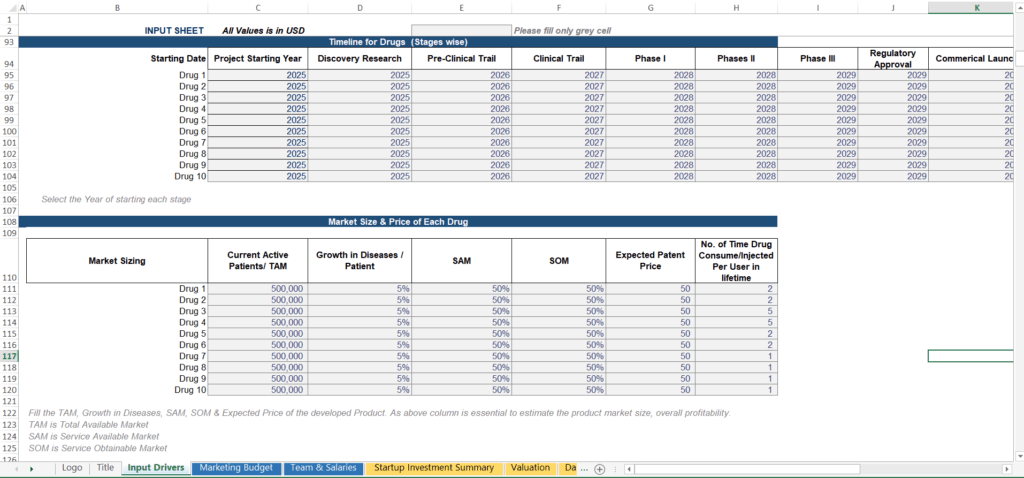
1. Clinical Development Timeline (Stage-Gate by Drug)
The first block every biotech model needs is a stage-wise timeline for each therapeutic asset. For each drug in your pipeline, you assign a starting year to every development phase:
- Discovery Research
- Pre-Clinical Trial
- Clinical Trial
- Phase I
- Phase II
- Phase III
- Regulatory Approval
- Commercial Launch
Don’t just outline the sequence of events; map every phase to a specific calendar year. This timeline is essential for tracking your cash flow, as it defines exactly when R&D expenses occur, when milestone payments are collected, and the precise moment product revenue or royalties begin.
Why this matters for forecasting: A one-year Phase III delay does not just push revenue back by one year. It compresses your patent exclusivity window, delays milestone receipt, and reduces the Net Present Value of the entire program. Investors will test this by asking: “What happens to your valuation if Phase III is delayed by 18 months?” Your model must answer that question dynamically, not manually.
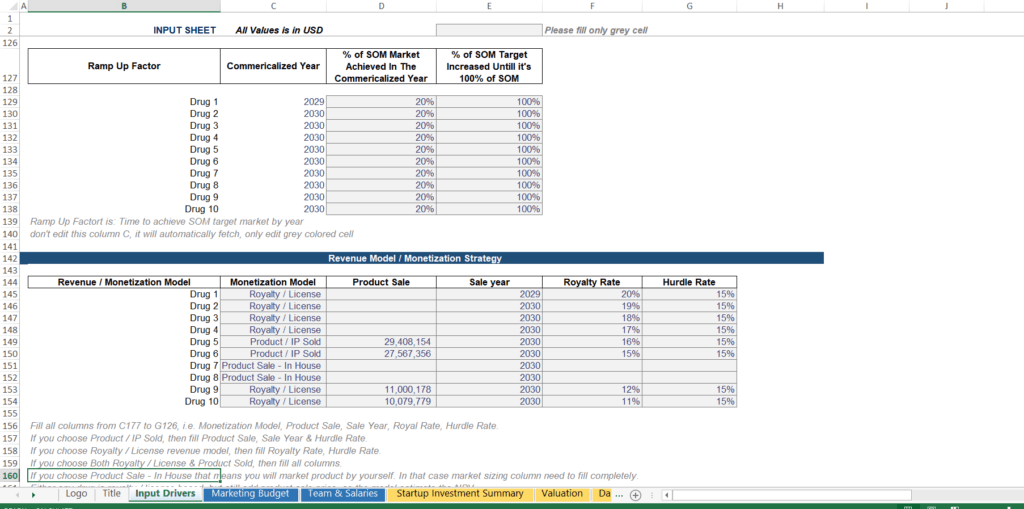
2. Market Sizing Inputs: TAM, SAM, and SOM
Every revenue projection must be anchored to a bottom-up patient population analysis. For each drug in your pipeline, the model requires you to define:
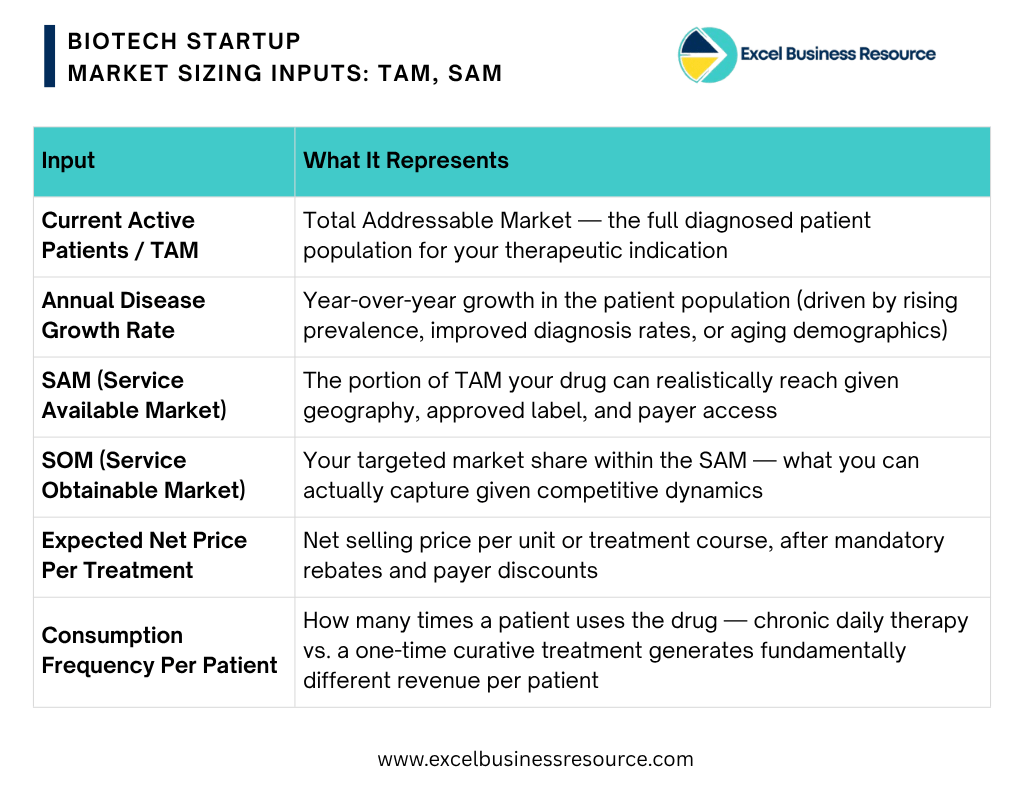
Founder’s Tip: Don’t confuse the Total Addressable Market (TAM) with your actual revenue potential. Use SAM and SOM filters to narrow down the total market to the specific patient population you can realistically reach. Your revenue calculations—price multiplied by usage—should only be applied to your SOM, not the headline TAM. Experienced investors will spot an inflated forecast immediately.
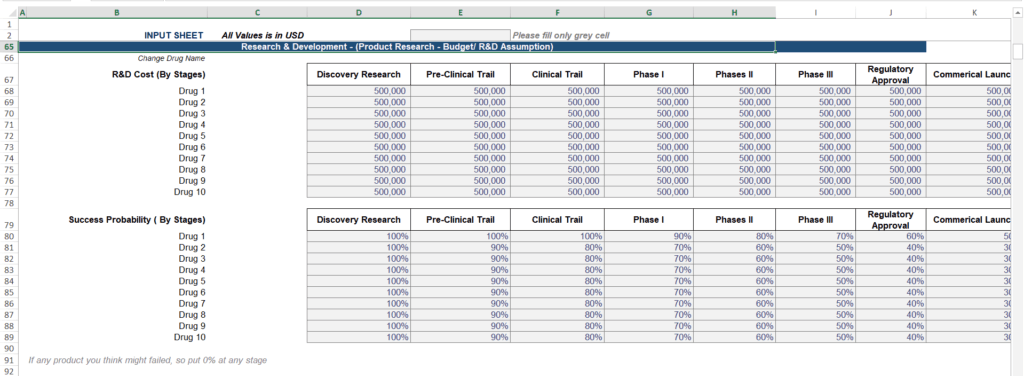
3. R&D Cost Assumptions by Stage and Drug
The second major input block is your R&D cost plan, structured stage-by-stage for each drug. You define a budget per development phase — Discovery, Pre-Clinical, Clinical Trial, Phase I, Phase II, Phase III, Regulatory, and Commercial Launch in excel. (Obviously, it’s a forecasting, your actual figure might be different but it’s a road map, gives you a clarity of execution).
In practice, Phase III is almost always the most capital-intensive stage, often representing 40–60% of total program R&D spend. Your model must reflect this cost concentration rather than distributing R&D spend evenly across phases. Then the model should automatically times each drug’s cost to the calendar year its corresponding clinical stage is scheduled to occur.
To understand the complete capital requirements of building a biotech from the ground up, see this detailed breakdown of how much it costs to build a biotech startup.
Step 2: Modeling Diverse Revenue Streams — Four Monetization Strategies
One of the most consequential decisions in your biotech startup & biotech financial forecasting model is selecting the commercialization or revenue strategy for each drug in your pipeline. A well-structured model supports at least four distinct revenue models, and the choice between them fundamentally changes both your revenue trajectory and your capital requirements.
For a comprehensive breakdown of how biotech companies generate revenue across all stages of development, see this detailed guide on how biotech startups make money.
Option 1: Royalty / License
You out-license your drug to a pharmaceutical partner who funds development and commercialization. In return, you receive:
- Upfront payment at deal signing (non-dilutive cash, typically 5–15% of total deal value)
- Milestone payments triggered by clinical, regulatory, and sales events
- Tiered royalty rates on net sales — typically 8–20%, escalating as annual sales cross defined thresholds
Modeling tiered royalties requires building year-by-year cumulative net sales projections and applying the correct royalty rate to each tranche. Flat royalty assumptions are a common error that either overstates or understates royalty income depending on the sales trajectory.
Patent expiry is the critical variable that terminates royalty streams. Your model must map every royalty-generating asset to its composition-of-matter patent expiry date and model the revenue decline triggered by generic or biosimilar entry typically 12–24 months post-expiry for small molecules, 24–36 months for biologics.
Option 2: Product / IP Sold
You sell the intellectual property rights to a partner or acquirer for a negotiated lump sum. This generates immediate, clean cash crystallization with no ongoing royalty stream. This approach is most appropriate for programs where you have demonstrated clinical proof-of-concept and want to re-deploy capital into earlier-stage assets.
Option 3: Product Sale — In House
You build your own commercial infrastructure and sell the drug directly to the market. This captures the full product margin but requires significant investment in work force, medical affairs, distribution networks, and infrastructure specially before the first commercial sale occurs. The marketing budget must be explicitly modeled by drug and by year, starting from the commercial launch year.
Option 4: Hybrid (Royalty + IP Sale)
Some deals combine an upfront IP payment with ongoing royalties on net sales. This structure requires modeling both the lump sum recognition event and the tiered royalty stream independently.
Milestone Payment Modeling
Regardless of monetization strategy, your model should capture four categories of milestone payments:
- Clinical Milestones: Triggered by Phase completion events (e.g., first patient dosed in Phase III, Phase II data readout)
- Regulatory Milestones: Triggered by NDA/BLA submission, FDA approval, or EMA approval
- Sales-Based Milestones: Triggered when annual net sales cross defined commercial thresholds
Each milestone must be probability-weighted by the PTRS at the point it would be triggered, then discounted to present value.
Step 3: R&D Cost Cash Flow — Timing Your Burn Against Clinical Milestones
A critical modeling discipline that separates professional biotech models from amateur spreadsheets is stage-gated cost timing. R&D spend is not a flat annual expense — it accelerates dramatically as programs advance into more expensive clinical phases, particularly Phase III.
A correctly built model auto-times each drug’s R&D expenditure to its clinical stage calendar year. The practical implication is that when multiple drugs reach Phase III simultaneously, your total R&D burn spikes sharply often representing the single largest annual cash outflow in your entire forecast. This spike is the primary driver of how much capital you need to raise.
This stage-gated cost visibility is what VCs use to assess cash runway against clinical milestones — one of the most scrutinized elements of any biotech due diligence process. The KPIs investors track against your milestone schedule are covered in detail in the Top 10 Biotech Startup KPIs for Investors.
Step 4: Investment Summary — Calculating Your Total Capital Requirement
Once your R&D costs, CAPEX, and operational expenses are modeled, the Startup Investment Summary consolidates everything into your total capital requirement. This section of the model answers the question every investor will ask: “How much do you need, and what does it get you?”
CAPEX Planning
Capital expenditure should be structured by asset type and timed to when each piece of infrastructure is actually needed — not front-loaded into Year 1:
- Lab and research equipment (needed at program initiation)
- Software and data infrastructure (needed as programs scale)
- Compliance and regulatory systems (needed pre-submission)
- Manufacturing or production facilities (needed pre-commercial launch)
Spreading CAPEX appropriately across the development timeline preserves early-stage cash runway — a critical survival discipline for pre-revenue biotech companies.
Operating Expense Structure
Your operational cost model must include every line item that scales with the business: payroll, R&D cost, sales and marketing (by drug and by monetization model), rent, IT infrastructure, insurance, legal fees, accounting, and regulatory registrations — each with a defensible annual growth assumption.
What the Investment Summary Must Tell You
A complete investment summary should output:
- Total startup CAPEX and initial operating expenses
- Lowest projected cash position across the entire forecast horizon — this is the maximum cash deficit the company will reach, which defines the minimum capital you must raise
- Safety buffer (typically 15–25%) to cover unexpected clinical delays, cost overruns, or market access challenges
- Total investment required to raise, including the safety buffer
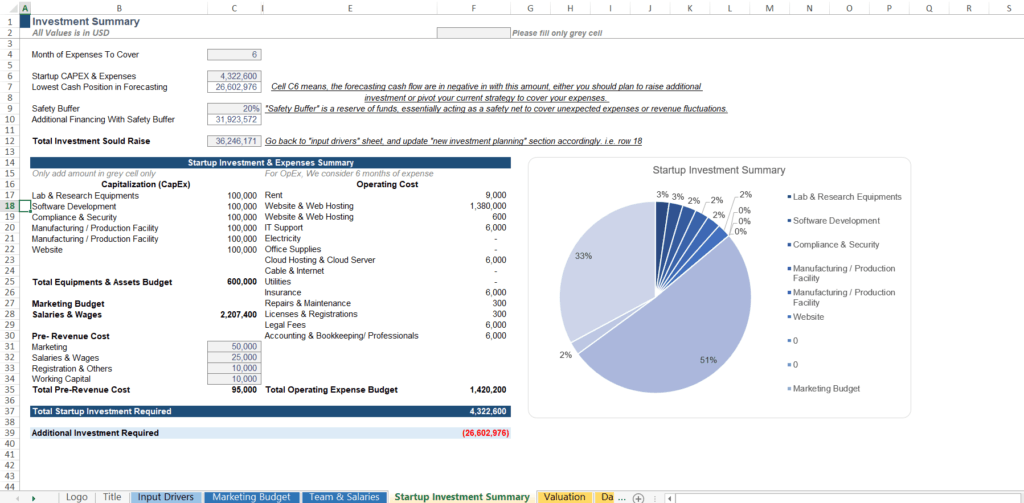
The most important number in your model is not your peak sales projection — it is your lowest cash position. That number tells you and your VC exactly how much capital you need before the business becomes self-sustaining. Building your strategic clinical roadmap around this capital requirement is a core component of your biotech business plan — see how to write a biotech startup business plan for a full framework.
As your startup scales from research-stage startup toward late-stage clinical development, operational discipline becomes as important as scientific execution. The frameworks covered in 10 Critical Pillars Every Founder Must Master to Scale apply directly to biotech organizations navigating that transition.
Step 5: Manual Modeling vs. Professional Biotech Financial Template
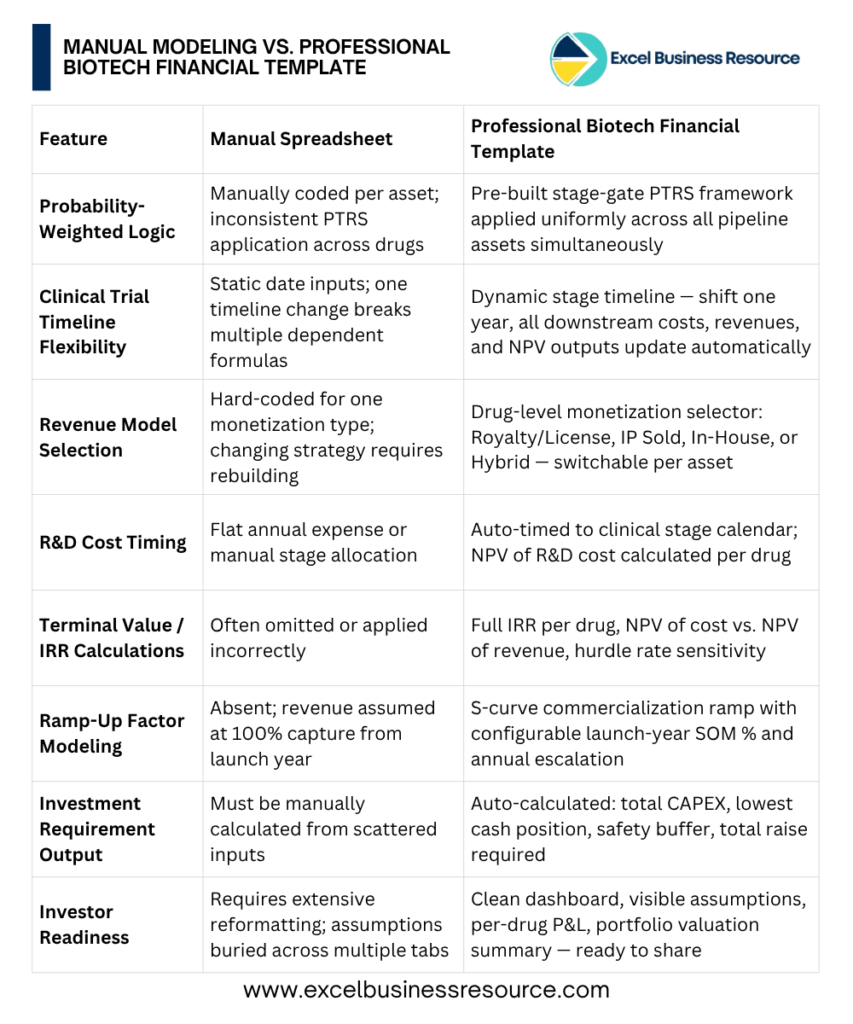
The Bottom Line: Build a Model That Survives a Boardroom
Biotech revenue forecasting is not an exercise in optimism. It is a structured, probabilistic discipline that integrates clinical science, regulatory strategy, commercial intelligence, and financial modeling into a single coherent framework.
When done correctly — with stage-gated timelines, PTRS-weighted revenue projections, multiple monetization models, structured CAPEX planning, and NPV/IRR per drug — your model does three things simultaneously:
- Guides internal decision-making: Which drugs to prioritize, which to deprioritize, and how to allocate capital across a multi-asset pipeline
- Communicates credibly to investors: Every assumption is visible, traceable, and benchmarkable against industry data
- Survives due diligence: Because the model is architecturally correct — not reverse-engineered to hit a target valuation
Starting your financial model from scratch in Excel relying on manual risk adjustments and rigid timelines takes over 100 hours and often results in technical glitches. These structural flaws usually surface at the worst possible time: right in the middle of a high-pressure investor pitch when your credibility is on the line.
Download the Professional-Grade Tool — Save 100+ Hours
The complete modeling framework described in this guide is built and ready to use in the Biotech Financial Model & Valuation Template from Excel Business Resource.

Instead of spending weeks building what already exists and risking the formula errors that can reduce the chance of an investment, use a dynamically built, professionally structured Excel model designed specifically for life sciences founders and CFOs.
- Model multiple drugs simultaneously with individual assumptions per asset
- Four monetization strategies: Royalty/License, IP Sale, In-House, and Hybrid
- Stage-gate PTRS inputs with automatic probability-weighted NPV calculation
- Dynamic clinical timeline with cascading cost and revenue outputs
- Full investment summary: CAPEX, OPEX, lowest cash position, safety buffer, total raise required
- Per-drug IRR and portfolio-level valuation dashboard
- Investor-ready formatting — present with confidence on Day 1
Your science deserves a financial model that matches its rigor.
→ Get the Biotech Financial Model & Valuation Template — Save 100+ Hours
→ Review other Healthcare & Life Science Financial Model Templates