

Why Excel Is Best For Startup Revenue Forecasting
Revenue forecasts are the heart of your startup’s financial planning. They predict future income based on variables such as customer acquisition, pricing, and market changes, and help you avoid cash shortages and discover growth opportunities. According to a report by CB Insights, 38% of startup failures are due to lack of money – solid financial forecast models can prevent this. From my experience as a consultant in financial modeling, I have seen founders use these models to raise more than 50 million US dollars in venture capital by showing clear paths to profitability.
Excel here due to accessibility, versatility, and the absence of cost barriers for teams in an early phase. Forget expensive software; an Excel financial model for startups allows you to integrate functions like SUMIFS and VLOOKUP for real-time updates. For reliability, always base your models on clean, historical data garbage in, garbage out.
If you are starting from scratch, use our Excel financial model template directory, a ready-to-use financial model template for industries like fintech or retail, BESS, manufacturing. Moreover startup consulting services offer expert financial modeling services to refine your approach.
Let us now analyze the hacks with step-by-step insights based on expertise.
Hack #1: Create a modular structure for your Excel financial model
Organization is the cornerstone of any reliable financial forecast model. Put all the data in one excel sheet leads to errors, confusion & create leaking value model. I have seen how this can derail pitch presentations in my consulting work with startups.
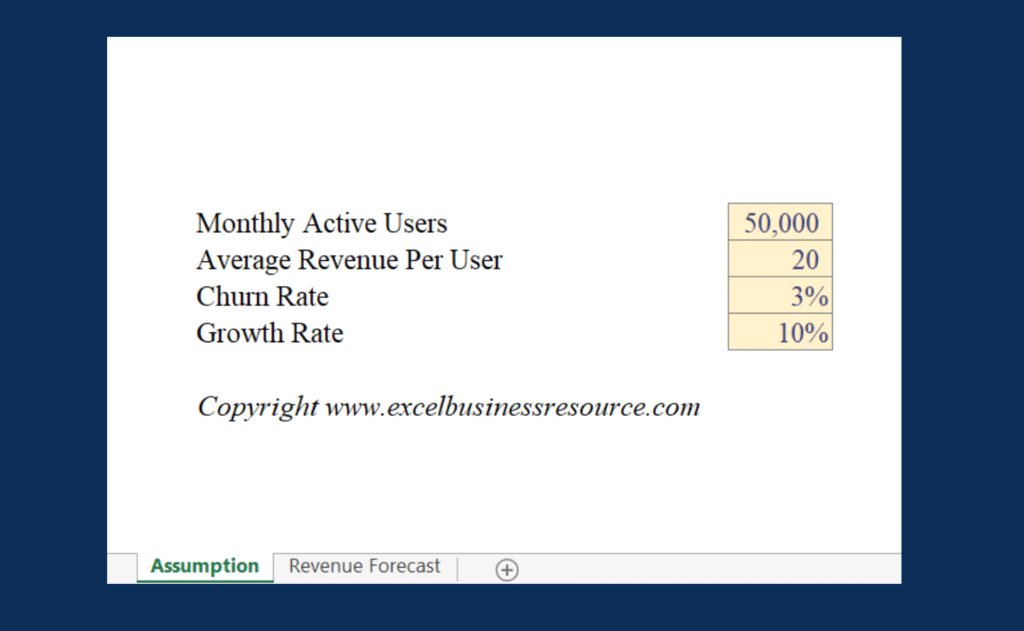
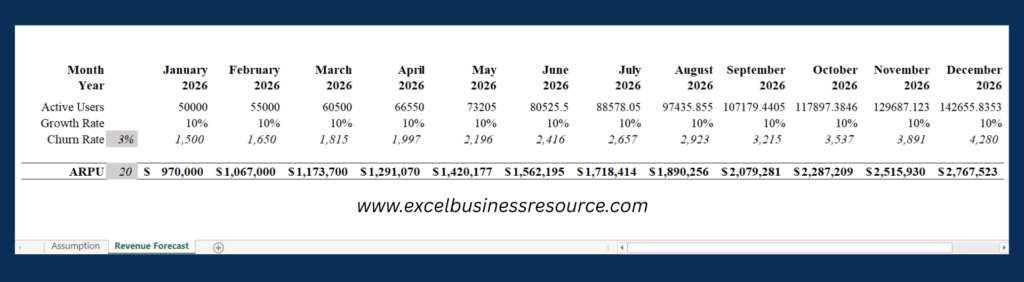
The simple solution is to create a modular budgeting financial model with assigned tabs i.e. assumptions for inputs such as monthly active users (MAU), average revenue per user (ARPU), churn rate, and growth rates; revenue drivers for breakdowns, then a separate tabs for output calculations like 3 statements, KPIs, valuations, summary.
This excel model layout ensures that changes in assumptions automatically align with an output, without intervention.
For example, projected revenue can be calculated formulaically as MAU * ARPU * (1 – Churn).
Pro tip: Use color coding like light yellow color for adjustable inputs drivers, blue for locked calculations to make it logical. Also data validation in excel to lock business drivers’ ranges, for example only positive churn values. This investor-friendly design help VC’s to test multiple variables, without breaking anything, which builds confidence in your financial outlook.
Hack #2: Use Historical Data with TREND and FORECAST Functions
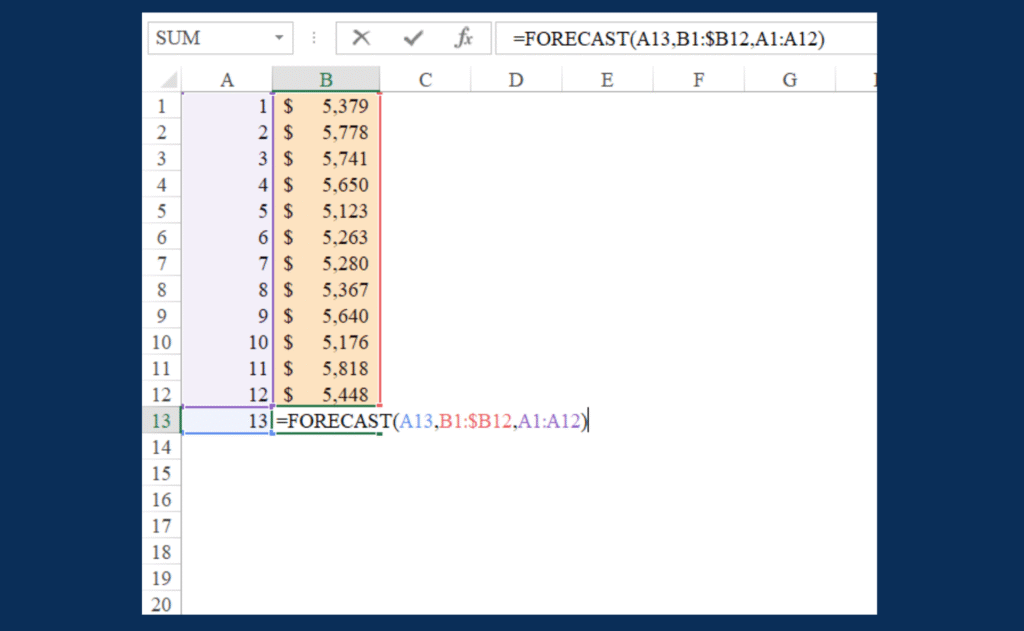
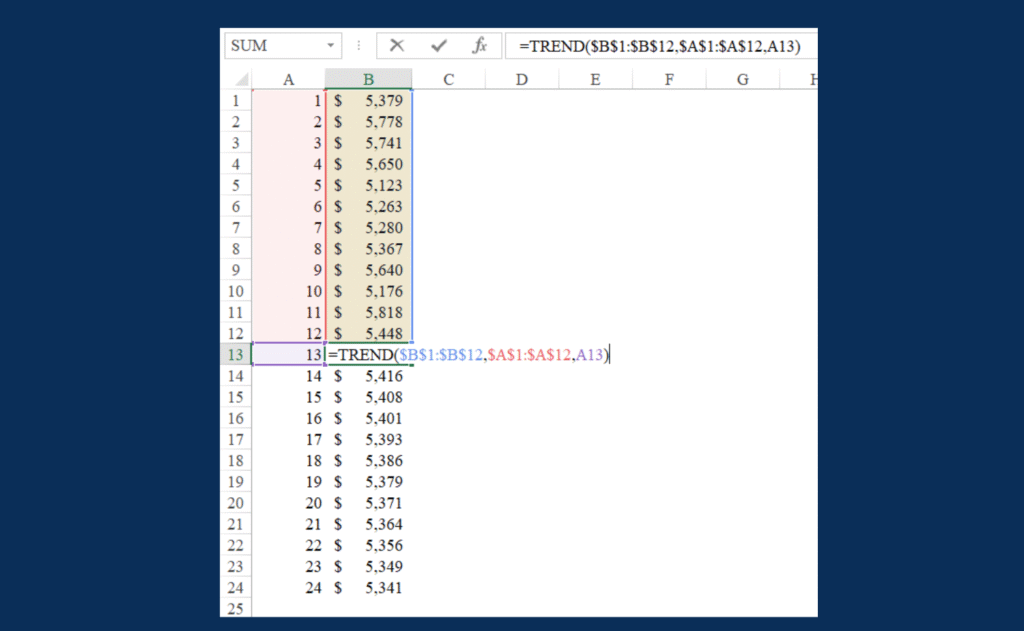
Using historical data in combination with Excel’s TREND and FORECAST functions is one of the critical practices that allow ambitious business people to properly design a financial projection model for their start-up. The main advantage of these statistical instruments is that they help establish a solid understanding of how the company’s revenues will develop in the future based on the past performance.
Both of these functions are relatively easy to implement because they only require a set of historical data to provide linear input projections. In practice, TREND and FORECAST can be used to estimate the expected revenue at the end of the reporting period and build a financial model based on the dynamic behavior of historical data.
When I was preparing a projection for my bookkeeping clients, I used TREND to make estimates for the holiday season sales, which ultimately allowed me to perform closer to reality cash flow estimates and impress my clients with the clean-looking growth curve.
Observe the images below, how these formulas work.
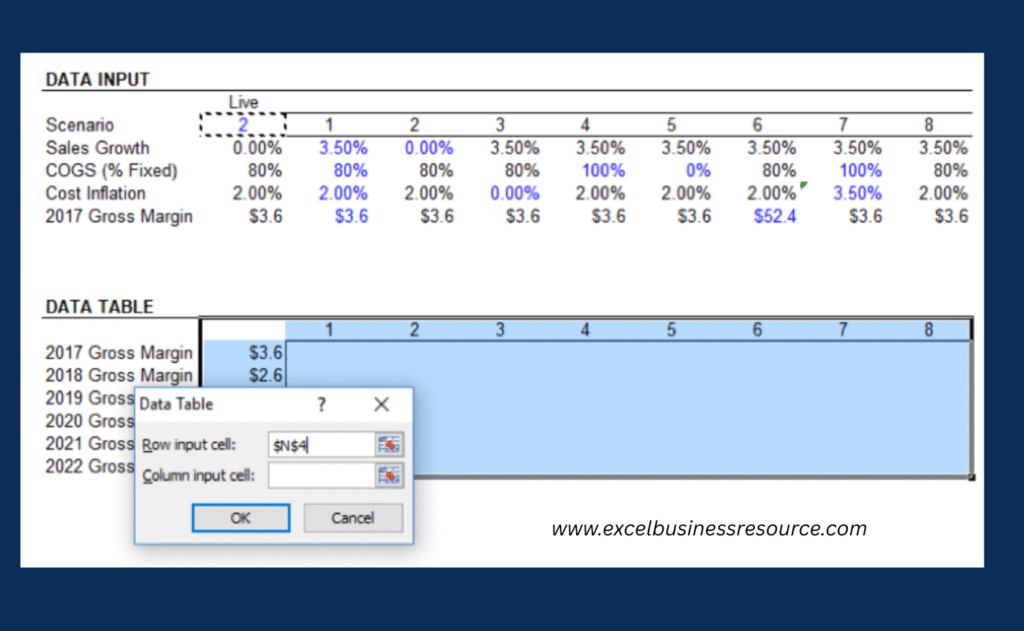
Hack #3: Build Scenario Analysis with Data Tables
Uncertainty is a startup constant, so single-path forecasts fall short. Scenario analysis via Excel’s What-If Data Tables lets you model best-, base-, and worst-case outcomes in your financial forecasting models. Set up variables like growth rates (5-15%) and watch revenue projections adjust instantly.
The tool helps you identify risks and address them strategically. Here’s an example: ‘what if our churn rate grows by 2x?’ This analysis is particularly useful for start-ups, as it helped one of our clients who used our financial modeling services to rework their strategy, thus cutting their losses by 25%. Try Excel scenario manager to plan your financial future and mitigate risks. And be sure to use our free excel financial model template as well.
Hack #4: Incorporate Cohort Analysis for Subscription Models
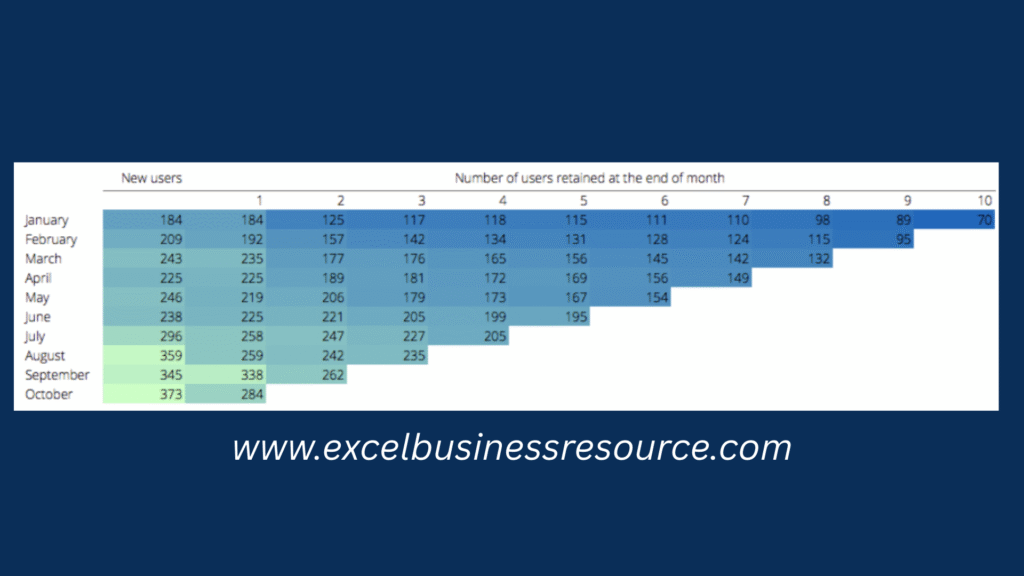
Cohort analysis visualizes a customer base’s evolution over time allowing you to gauge the lifetime value and retention of your subscribers and, consequently. If you are in SaaS business then it is a super usefull to predict your SaaS’s revenue with greater precision. Instead of grouping all the users in one column, you split them into cohorts that share a characteristic (typically the date of their first purchase or subscription) and track their behavior on a monthly basis.
This makes it easier to spot churn patterns, improve onboarding, and understand how long customers stay. It also makes revenue forecasting more accurate by showing how customer value changes over time.
Hack #5: Leverage PivotTables for Driver Breakdown
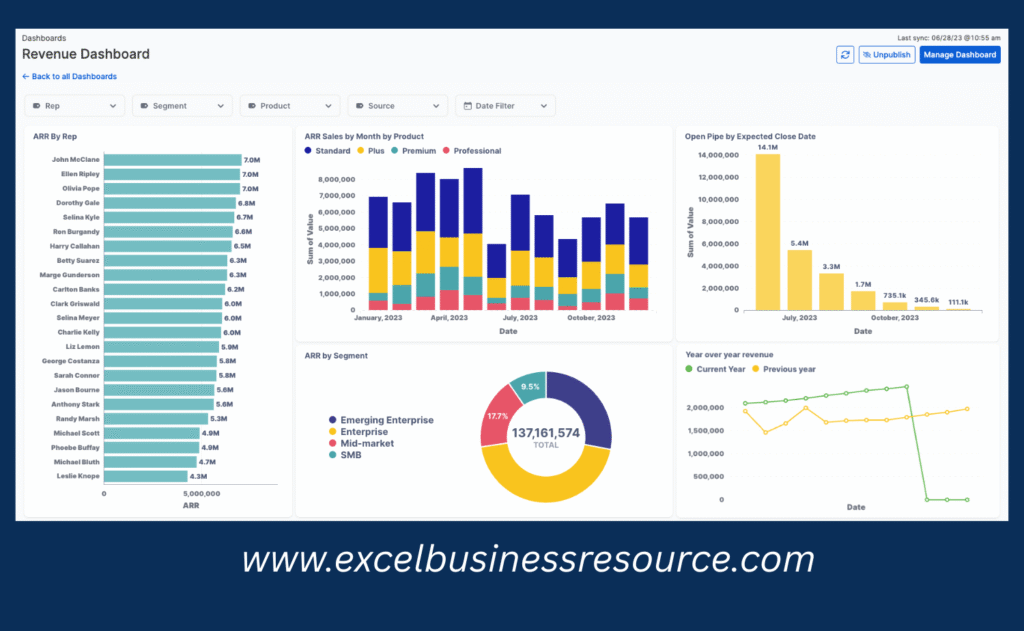
PivotTables can be extremely useful to a start-up company’s founder who wants to design an informative financial spreadsheet and understand the drivers of the firm’s revenue. They are particularly effective when used to summarize the information needed to analyze the contribution of various business areas, such as product lines or promotion channels, and identify those with the highest impact. This way, it will be possible to optimize the allocation of resources and thus improve the forecast produced by the financial model.
The key benefit of this approach is that it makes the analysis of the revenue sources easier and more structured. It will enable the management to identify the areas which contribute the most to the company’s revenue and thus require additional investment. For example, if the email marketing campaign is found to bring the highest percentage of sales, the company may want to consider investing more in this particular channel. At the same time, the model will also highlight the weak points and thus help the firm optimize its spending. This tool is also valuable because it is dynamic and can be used in the day-to-day operations to discuss the drivers of revenue. With PivotTables, it will be possible to quickly segment the data and display the necessary information to the management, customers, or investors.
For this type of analysis, the benefit of using such a tool is immense. The model will help to structure the information needed to analyze the drivers of revenue and prioritize the areas of spend based on their impact. It will be much easier to prepare the forecast and provide accurate information to the stakeholders, which, in turn, will benefit the start-up by helping it become more competitive.
Hack #6: Automate Sensitivity Analysis with Sliders
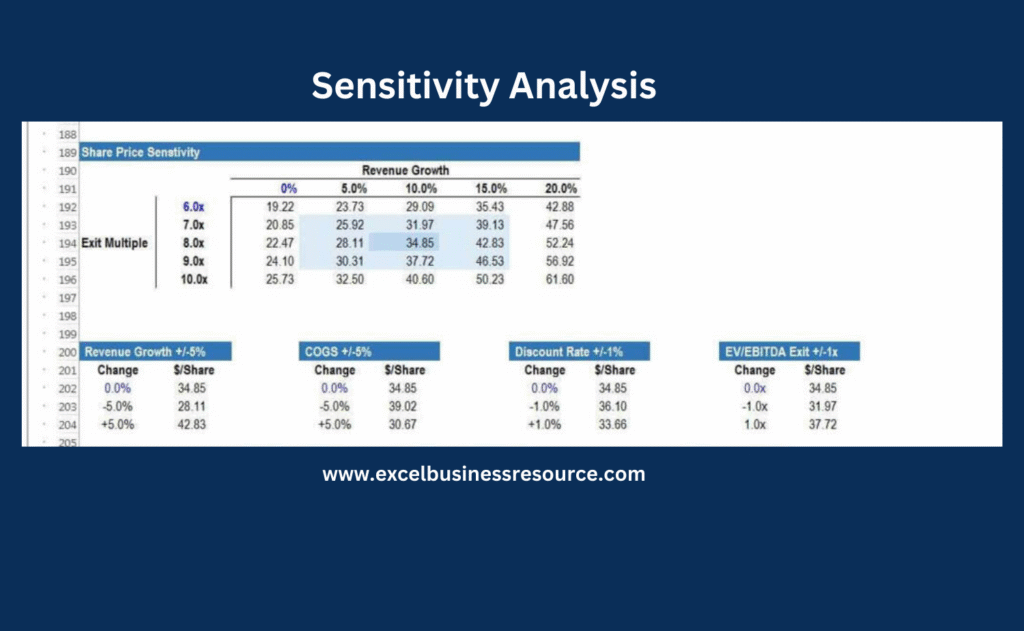
Make your sensitivity analysis interactive with Excel sliders. Link a slider to key assumptions like prices, customer growth, or churn, and instantly see how changes affect your revenue forecast.
This makes a ‘what-if’ analysis faster and easier, especially when testing different scenarios or showing your model to investors. Instead of changing numbers manually, you can just move the slider and see the effect.
Hack #7: Integrate Monte Carlo Simulations for Risk Assessment
Go beyond a single forecast by adding Monte Carlo simulation to your Excel model. Perform hundreds or thousands of scenarios with variables such as sales growth, pricing, churn, or costs and see their probability distribution over revenue and cash flow.
This can help you understand the range of possible outcomes and where you have the most risk. This is a great way to stress-test your forecast and make better decisions before any of these issues manifest in the real world.
Hack #8: Visualize with Dynamic Dashboards
After creating your assumptions & financial statements, build attractive dashboard that provides an easy-to-read summary of the business. Visualize the most important metrics of your business, such as revenue, gross margin, EBITDA, cash, burn rate, runway, customer growth, and others, on charts, graphs, and KPI cards.
Make the dashboard interactive by linking it to the model inputs and add slicers or scenario selectors to analyze different views of information. Drill down into the relevant parts of the spreadsheet to understand what drives the business and uncover insights fast.
An executive dashboard is a single page containing charts, graphs, and other visual elements that turn numbers and formulas into context. It should be visually appealing but contain enough information to help you quickly size the situation, see the trends, and highlight any red flags. At the same time, the financial model dashboard will help you tell a story to investors and provide an easy-to-understand summary of projections.
Hack #9: Error-Proof with Conditional Formatting and Validation
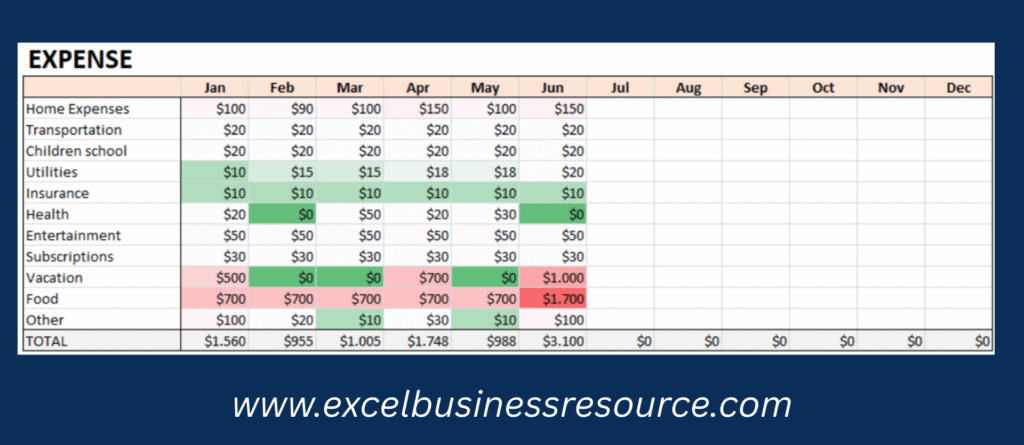
When building a financial plan, there are many details to pay attention to, and it is easy to make a mistake and provide incorrect data to Excel functions. Several minor errors in a financial model can add up to substantial errors in financial forecasts, and therefore it is essential to implement a few helpful checks before finalizing the model.
One of the most common and easy ways to add basic controls to a financial model is to use conditional formatting. Using Excel’s conditional formatting feature, it is possible to mark cells that contain values that seem odd or simply draw attention to specific cells in the workbook. For example, it is possible to draw attention to negative cash flows, unusually high operating expenses, or low profit margins by highlighting them in red. Additionally, one can use data validation to ensure that only the correct type and value of data is entered into cells, for example, a positive number or a percentage. Lastly, a financial model that uses Excel may be easier to review and control if the final version of the budget or forecast has been prepared using data validation and conditional formatting techniques.
Hack #10: Scale with External Data and Power Query
As your startup grows, you’ll have more data coming from different places your CRM, sales reports, market research, or even CSV files. Instead of copying and pasting all that data into Excel every time, let Power Query do the work for you.
Power Query can be used to import the data and clean it up before using it in Excel. For instance, if one’s monthly sales data resides in the company’s CRM, it could be imported into Excel using Power Query and serve as the projection for the revenue stream. Once new data is available, it would be enough to simply refresh the query in order to update the numbers.
This trick could prove to be very useful in automating one’s financial projections while saving time, effort, and reducing errors from tedious copy-pasting of data between applications.
Bottom Line
These 10 hacks transform your excel financial plan into a powerhouse for investor ready financial projection model. From modular structures to advanced simulations, they’ve helped my clients in startup consultancy services achieve precise, scalable growth. Remember, expertise builds over time, so start simple, iterate, and trust the process.