
If you’re trying to build a startup financial forecasting model, you’ve probably noticed two things: most templates online are too generic, and most guides skip the part that actually matters your business drivers. Whether you’re a founder preparing for a fundraise, an analyst building your first model, or a student trying to understand how investor-ready models work, this guide walks you through how to build a startup financial projection model the same way professional FP&A consultants build one: tab by tab, driver by driver.
This isn’t a theory post. It’s a practical, step-by-step guide to build a startup financial model that a founder can actually use to raise money, plan cash, and make decisions and that an investor can actually understand in under five minutes.
Why VCs Reject Complex Financial Model Spreadsheets?
A financial model isn’t a test of how many complex formulas you can cram into a spreadsheet. The best startup financial model is the one a founder and an investor can open, understand, and trust immediately.
Most early-stage models fail for three reasons:
- They’re built backwards — formulas come first, business logic comes later (or never).
- There’s no consistent structure, so every tab looks like a different file.
- Assumptions are buried inside formulas instead of being visible, editable inputs.
If you’ve ever opened a financial model and felt lost within thirty seconds, that’s not your fault — it’s a design problem. A well-structured startup financial forecasting model fixes this with three things: simplicity, clarity, and consistent formatting.
The Foundation: Color-Coding and Tab Structure
Before you build a single formula, set up a system. Every professional financial model template follows a consistent color code throughout:
- Yellow cells — inputs, drivers, and assumptions the user changes
- Black or default text — formulas and calculations (never manually overwritten)
- Blue or green — links pulled from another tab
This sounds small, but it’s the difference between a model an investor trusts and one they question. Consistency tells the reader: “this was built by someone who knows what they’re doing.”
Next, organize your workbook into clearly named tabs. An investor or founder should be able to glance at the tab names and immediately know where to find the income statement, the cash flow, or the sensitivity analysis without hunting. This single habit is what separates an amateur sheet from a true startup financial planning template.
Step 1: Build Your Driver and Assumptions Tab First
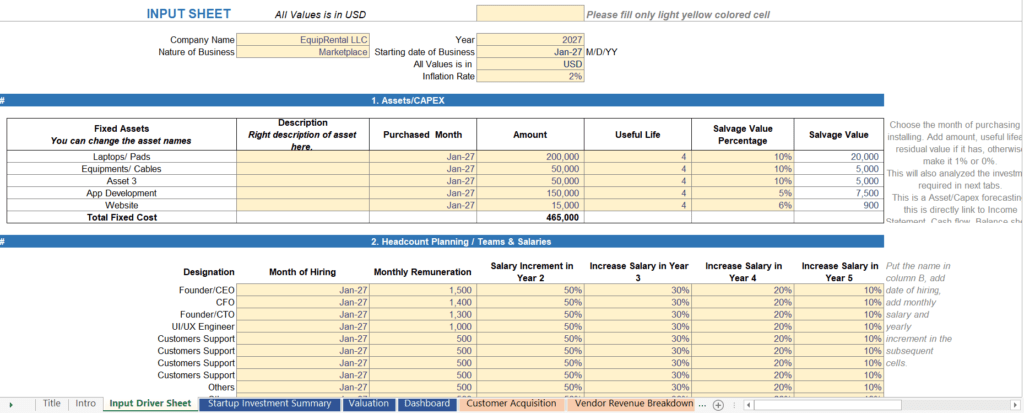
This is the single most important tab in the entire workbook, and it’s the one most founders skip or bury. Every number that flows through your income statement, cash flow, and valuation should originate from Assumption’s tab. Think of this tab as the control room of your startup financial forecasting model: nothing happens downstream until something changes here first.
Structure your assumptions tab into clear sub-sections, each one isolated so it’s easy to scan and edit:
- Investment assumptions — funding rounds, amounts raised, valuation at each round, and the timing of each raise
- Revenue assumptions — revenue streams, pricing per plan or product, growth rate, churn, and units sold or subscribers per month
- CapEx assumptions — equipment, software licenses, or infrastructure spend, along with useful life for depreciation
- Marketing budget assumptions — monthly or quarterly channel spend, expected customer acquisition cost, and conversion assumptions
- Variable cost / COGS assumptions — cost per unit, per transaction, or per customer served
- Headcount assumptions — who you hire, when, at what salary, and what taxes or benefits load gets added on top
- Operating expense assumptions — rent, software subscriptions, insurance, legal, and other recurring admin costs.
Keeping all of these sub-sections inside one tab means the founder always knows exactly where to go when something changes — say, a pricing update or a shift in churn rate. This is the essence of driver-based forecasting: every output in your model is driven by a handful of changeable inputs, not hardcoded numbers.
How to Actually Lay Out the Assumptions Tab
A few practical habits make this tab far easier to use:
- Group by category, not by formula complexity. Put all revenue-related drivers together, even if some feed monthly calculations and others feed annual ones. Founders think in categories, not formula logic.
- Label every input clearly with units. “Monthly Growth Rate (%)” is far less ambiguous than just “Growth.” Add a short note for anything non-obvious, like whether growth compounds monthly or annually.
- Keep a single source of truth for each variable. If churn rate is used in five different tabs, it should be typed once — in the assumptions tab — and referenced everywhere else through a cell link, never retyped.
- Use named ranges for frequently referenced drivers. This makes formulas in other tabs more readable, for example a clear name instead of a raw cell reference buried in another sheet.
- Leave room to grow. Startups pivot. Build in a few blank rows under each section so you can add a new revenue stream or cost line later without restructuring the whole tab.
This is also where most of the founder-friendly feel of a model comes from. An investor flipping through a clean, well-labeled assumptions tab immediately trusts the rest of the workbook more — because the foundation looks deliberate, not improvised.
Why Business Drivers Matter More Than the Formulas Around Them
Here’s something most guides don’t explain clearly enough: investors don’t fund spreadsheets, they fund assumptions. When a VC opens your model, they’re not checking your Excel skills — they’re stress-testing your business drivers.
- Drivers show the investor how you think about growth, not just what number you’re projecting.
- A driver-based model lets investors run their own scenarios by changing one cell, instead of asking you to rebuild the whole sheet.
- Clear drivers prove you understand your unit economics — cost per acquisition, lifetime value, payback period — which is exactly what due diligence focuses on.
- During fundraising, drivers become the negotiation language. “We assumed 8% monthly growth” is a conversation; a static revenue number isn’t.
If your model doesn’t expose its drivers, it’s not investor-ready — no matter how polished it looks. We’ve seen this firsthand: across 100+ startups and 500+ financial models built for different industries, the models that raised capital fastest were always the ones where assumptions were visible, editable, and well-labeled — not the ones with the most complex formulas.
There’s also a practical, day-to-day reason drivers matter beyond fundraising. Markets shift, costs change, and your first set of assumptions will almost never survive contact with reality. A driver-based model lets you update one number — say, customer acquisition cost after a bad marketing month — and instantly see the ripple effect across revenue, burn rate, and runway. Without that structure, every market shift means manually rebuilding parts of your model, which wastes time you don’t have during a fundraise or a tight cash month.
Step 2: Build the Tabs That Use Those Drivers
Once your assumptions tab is solid, the rest of the model should pull from it — never the other way around. Here’s the logical build order professional financial modelers follow, along with what actually goes into each tab.
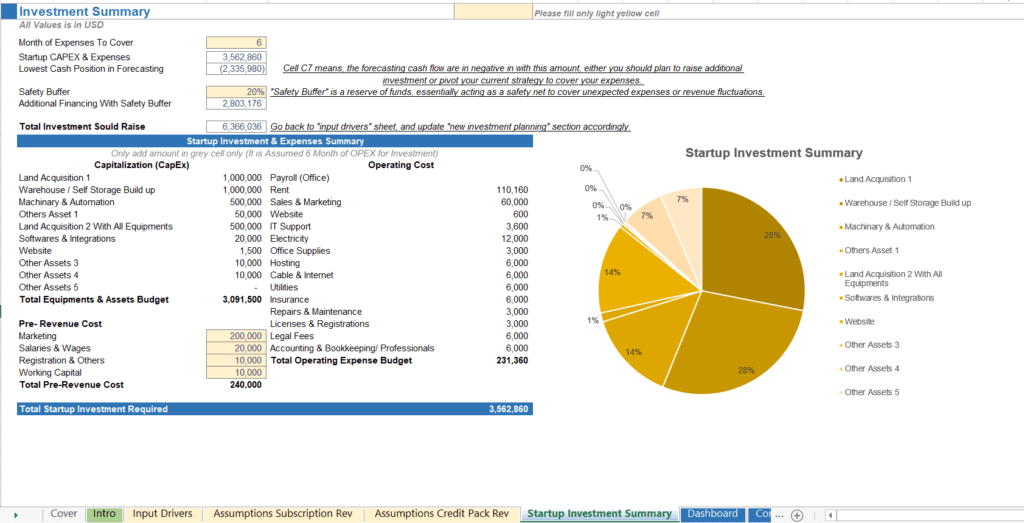
Use of Funds Tab
A simple table or chart showing exactly how raised capital will be allocated (product, marketing, hiring, operations). Investors ask for this constantly, and it should link directly to your assumptions.
Show this both as a table (dollar amount and percentage by category) and as a simple pie or bar chart. Investors often look at this before they look at your valuation — it tells them whether your spending priorities match the stage and story you’re pitching.
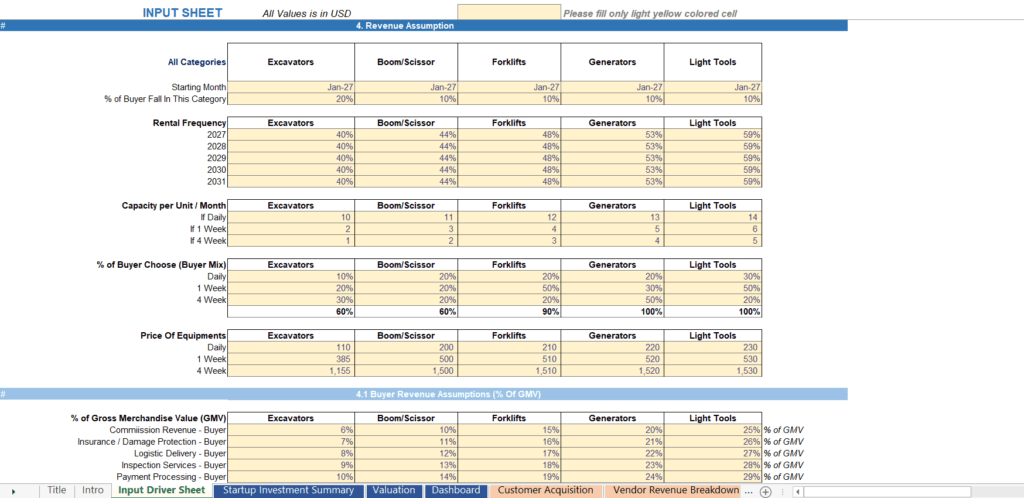
Revenue Forecasting Tab
Break revenue down by stream (subscription, product sales, transaction fees, marketplace commissions, etc.) and link every growth rate and price point back to your drivers tab. This is where your pricing and volume assumptions turn into a 12-to-60-month revenue build.
A good revenue tab separates volume from price. Instead of one blended “revenue” line, show units sold (or active subscribers) on one row and price per unit on another, then multiply them. This makes it instantly obvious whether revenue growth is coming from more customers, higher prices, or both — a distinction every investor will ask about. If you sell multiple products or have multiple customer segments, build a separate block for each one, then sum them into a total revenue line at the bottom.
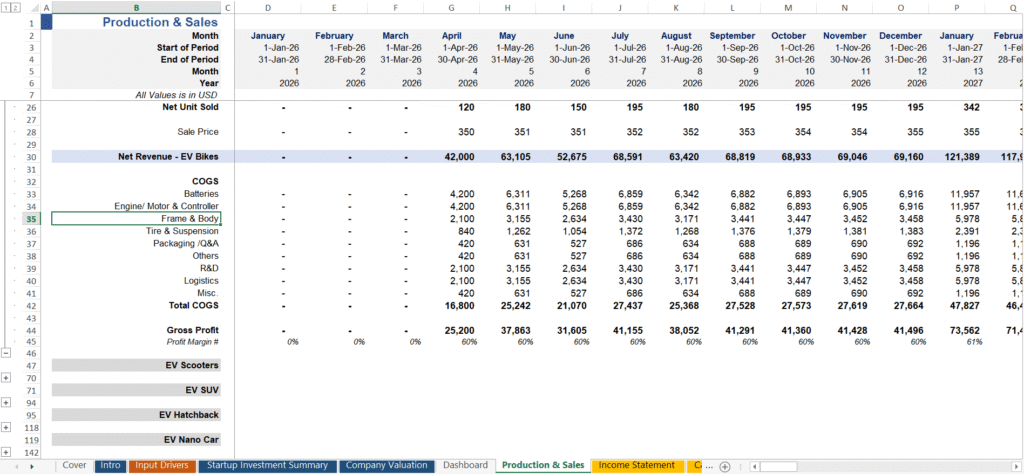
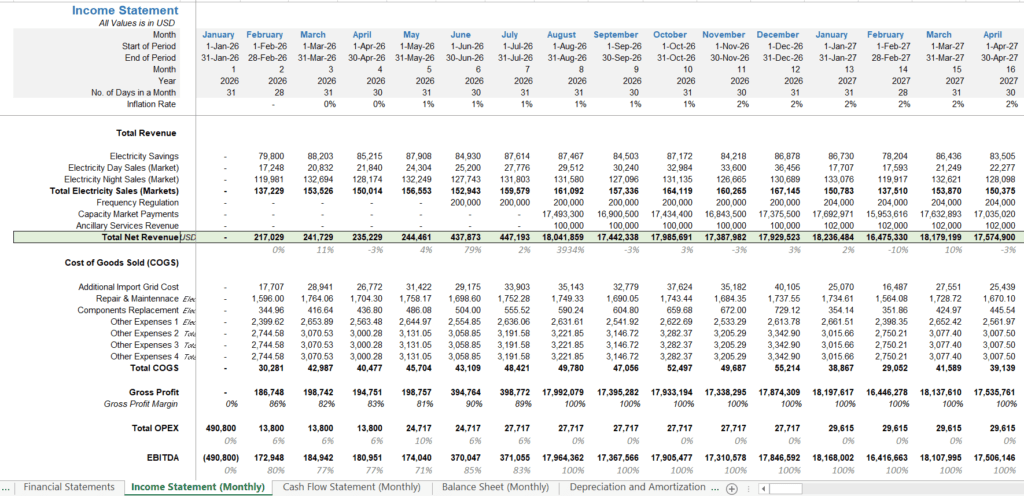
Monthly P&L, Cash Flow, and Balance Sheet
These three statements should be built monthly first, since early-stage startups live and die by monthly cash runway, not annual averages.
Your monthly P&L pulls revenue from the revenue tab, costs from COGS and opex assumptions, and payroll from the headcount tab. Your cash flow statement adjusts net income for non-cash items like depreciation, then layers in CapEx purchases, loan draws and repayments, and any funding raised — this is what tells you your actual cash position and runway. Your balance sheet ties everything together and should always balance; if assets don’t equal liabilities plus equity, there’s a linking error somewhere upstream that needs to be traced back.
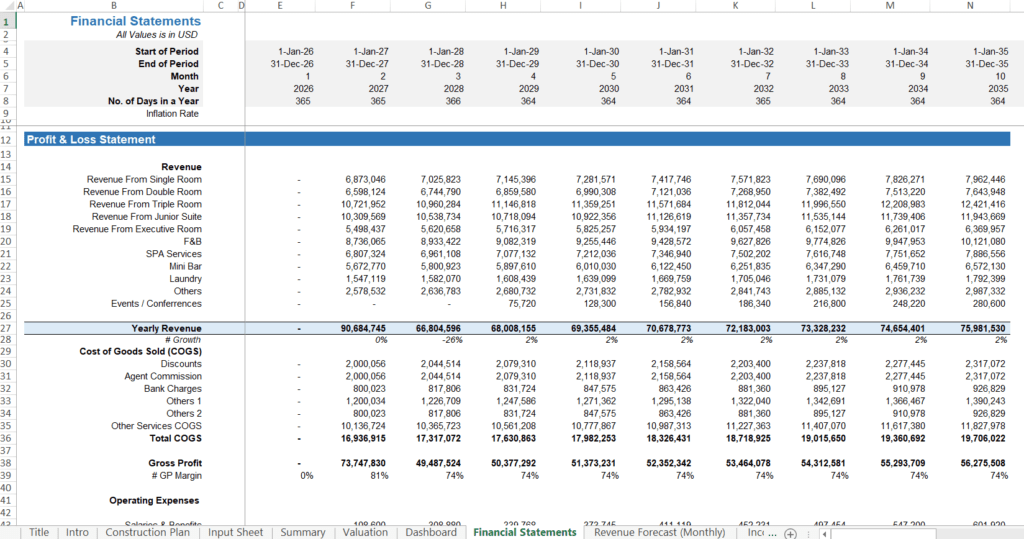
Consolidated Yearly Tab
Once monthly statements are built, roll them up into a clean annual view — this is usually the tab investors scan first.
This tab should mirror the structure of your monthly statements but summed by year, so an investor can quickly see year-over-year growth, margin trends, and profitability timelines without scrolling through 36 or 60 months of detail.
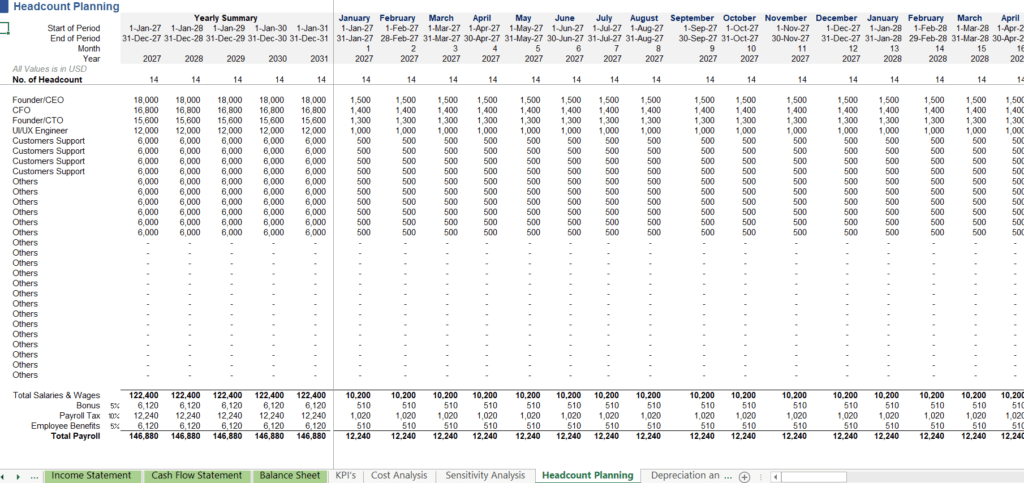
Headcount and Payroll Tab
Map out who gets hired, when, their salary, and any associated taxes or benefits. This tab usually feeds directly into your operating expenses and cash flow.
Build this as a timeline — one row per role, with a start month, monthly salary, and an automatic flag (using an IF formula) that turns the cost on starting the hire month and keeps it running forward. Include employer-side costs like payroll tax or benefits as a percentage loaded on top of base salary, since forgetting this is one of the most common ways founders understate their real burn rate.
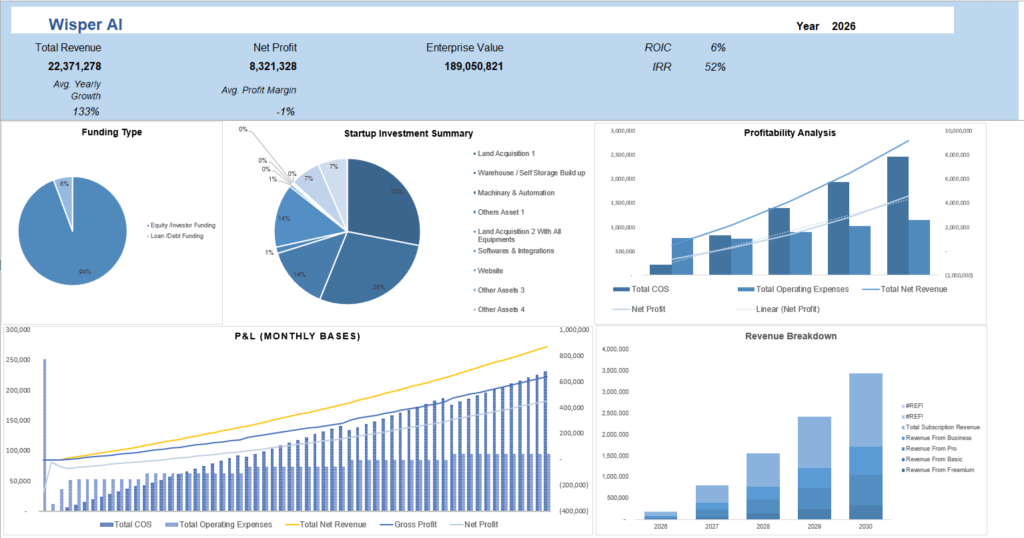
Dashboard Tab
A single visual summary — revenue trend, burn rate, runway, key KPIs — that lets anyone understand the business in 30 seconds without scrolling through every sheet.
A strong dashboard typically includes a revenue and growth chart, a burn rate and runway indicator, gross margin trend, and 3-5 KPIs specific to your business model (like CAC, LTV, or churn for a SaaS company). Keep it to one screen — if someone needs to scroll, it’s no longer a dashboard.
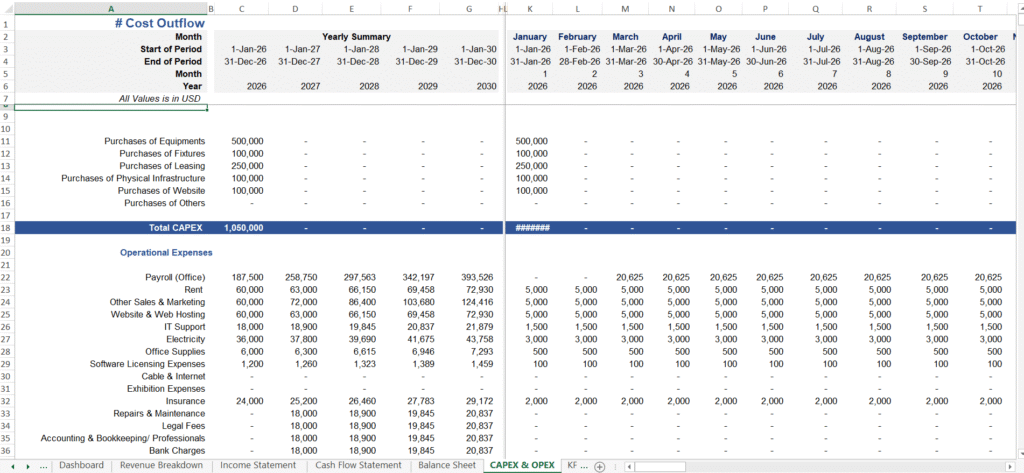
CapEx and Depreciation & Amortization Tab
Track every capital purchase and its depreciation schedule. This connects to your balance sheet and affects EBITDA-to-net-income calculations.
List each asset purchase with its cost, purchase date, and useful life, then calculate straight-line depreciation (cost divided by useful life in months) flowing into your monthly P&L. This tab matters more than founders expect — it’s the bridge between your cash flow statement (where the full purchase hits at once) and your income statement (where the cost is spread out over time).
Loan Amortization Tab
If you’re using debt financing, this tab calculates principal, interest, and repayment schedules — critical for accurate cash flow projections.
Set up the loan amount, interest rate, and term length as drivers, then build a standard amortization schedule showing the interest and principal portion of each payment. This split matters because only the interest portion hits your income statement as an expense — the principal repayment is purely a cash flow item.
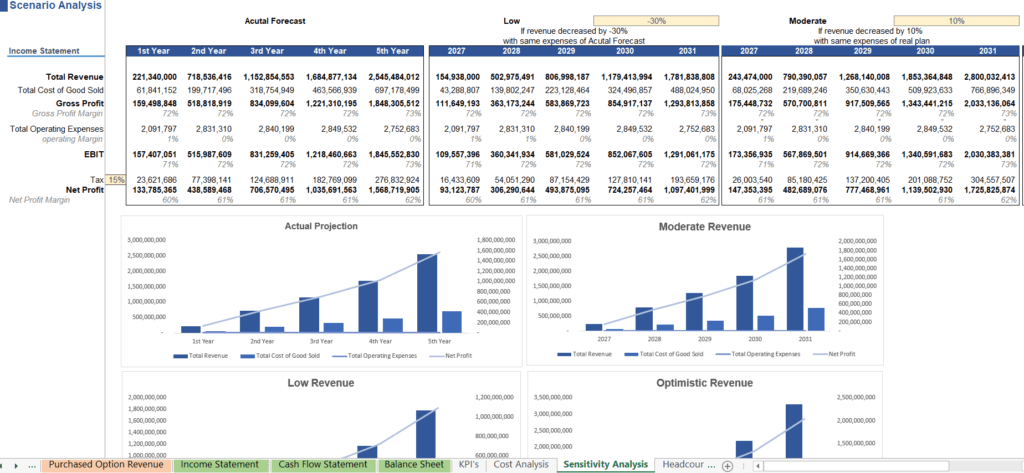
Step 3: Sensitivity Analysis — Plan for Reality, Not Just the Best Case
No startup financial model is complete without a sensitivity, or “what-if,” analysis. Build at least three scenarios:
- Worst case — conservative growth, higher costs, slower customer acquisition
- Base case — your realistic, most-likely projection
- Optimistic case — accelerated growth assumptions
The easiest way to build this without duplicating your entire model three times is to create a scenario switch — a single dropdown cell on your assumptions tab (using data validation) that toggles between “Worst,” “Base,” and “Optimistic.” Then use an IF or CHOOSE formula on each key driver (growth rate, churn, CAC, pricing) to pull the corresponding value for whichever scenario is selected. This way, one click recalculates your entire model end to end, instead of maintaining three separate workbooks.
This isn’t just good practice — it directly demonstrates to investors that you’ve stress-tested your own assumptions. A study by CB Insights on startup failure consistently lists running out of cash and misjudging market demand among the top reasons startups fail — a sensitivity tab is your defense against both being modeled away by overconfidence (cbinsights.com).
Beyond the three standard scenarios, it’s also worth testing single-variable sensitivity — for example, building a small table that shows how your 18-month runway changes if customer acquisition cost rises by 10%, 20%, or 30%. These small tables are often what investors poke at first, since they reveal how fragile or resilient your plan really is.
Step 4: Valuation — Turning Projections Into a Number Investors Can Negotiate
Once your financial statements are built, the valuation tab translates your projections into a defensible number. A strong valuation tab usually includes:
- DCF valuation — discounting projected free cash flows back to present value using your WACC
- EBITDA multiple valuation — applying industry multiples to your projected EBITDA
- Revenue multiple valuation — common for early-stage or pre-profit startups
- Investor’s method (VC method) — working backward from expected exit value and required return
For DCF, the key driver is your discount rate (WACC), which reflects the riskiness of your cash flows — early-stage startups typically use a higher rate than established companies because the uncertainty is greater. Project free cash flow for 5 years, discount each year back to today’s value, then add a terminal value representing everything beyond year 5. For revenue and EBITDA multiples, the trick is choosing comparable companies in your exact industry and stage — a multiple pulled from a mature public company will overstate an early-stage startup’s value, so always pull multiples from recent funding rounds or acquisitions in your specific space where possible.
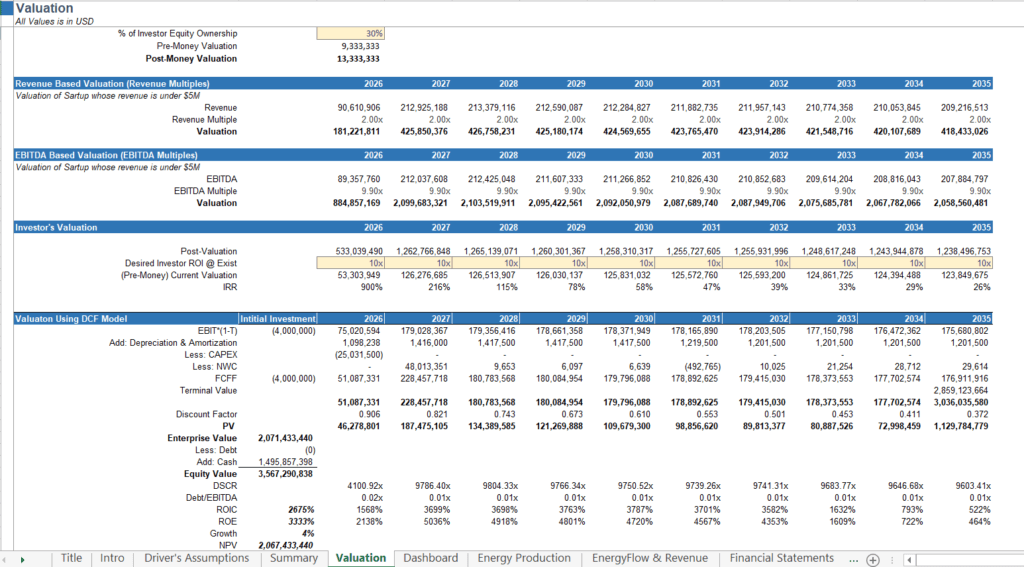
Round this out with a summary block showing payback period, NPV, and IRR — the metrics most VCs scan for first. Showing all four valuation methods side by side (rather than picking just one) is also a smart move — it shows investors you understand the range of reasonable outcomes rather than anchoring on a single optimistic number. For a full breakdown of methods, see our guide on startup valuation methods.
The Formulas That Make a Financial Model Actually Work
You don’t need hundreds of formulas, you need the right ones, used consistently. Here’s a quick overview of the core formulas every startup financial forecasting model relies on:
SUMPRODUCT — multiplies and sums arrays in one step, ideal for calculating total revenue across multiple products or pricing tiers at once.
- INDEX & MATCH — a flexible lookup combo that pulls values across tabs (e.g., pulling a specific month’s growth rate from your assumptions tab) without the row-limit issues of VLOOKUP.
Date formulas (EDATE, EOMONTH, DATEDIF) — keep your monthly timeline dynamic, so changing your start date updates the entire model automatically.
IF / IFS formulas – Handle conditional logic, like applying different commission rates above a sales threshold.
Growth formulas (CAGR, month-over-month growth) — drive your revenue and cost projections forward based on your assumptions tab.
These formulas are the backbone, but they’re not the whole story. If you want a deeper, hands-on breakdown of each one with examples, read our companion guide: 10 Excel Hacks Every Startup Founder Needs for Killer Revenue Forecasting.
Why a Driver-Based Forecasting Model is Essential For Fundraising
Here’s why building your driver-based forecasting model instead of static numbers matters so much:
- It lets you update one assumption and see the entire model recalculate instantly, instead of manually editing dozens of cells.
- It gives investors confidence that your numbers are grounded in logic, not guesswork.
- It speeds up due diligence, since investors can test their own scenarios without needing you to rebuild anything.
- It supports better internal decision-making — you can answer “what if we hire two engineers in Q3” in seconds.
- It’s reusable. As your business evolves, you update assumptions, not the entire architecture.
This is also exactly how VCs evaluate a financial model during due diligence — they’re checking whether your logic holds up, not just whether your final number looks good. You can read more in our breakdown of how VCs evaluate a startup’s financial model.
Common Mistakes That Ruined Startup Financial Models
Even well-intentioned founders make these errors:
- Hardcoding numbers directly into formulas instead of linking to the assumptions tab
- Skipping monthly detail and jumping straight to annual projections
- Ignoring cash flow in favor of just building a P&L
- Building one giant scenario instead of worst/base/best cases
- Inconsistent formatting that makes the model hard to navigate under investor questioning
If any of this sounds familiar, it’s worth reading why your startup financial model might be sabotaging your strategy — small structural issues often cause bigger fundraising problems than founders realize.
Should You Build It Yourself or Get Help?
Building your first startup financial projection model from scratch is absolutely doable with the structure above. But it’s also time-consuming, and small structural mistakes — a broken link, an inconsistent formula, a missing scenario — can quietly undermine your credibility in front of investors.
That’s exactly why applying effective financial modeling techniques reduces real operational and fundraising risk, and why many founders choose to outsource financial modeling services instead of building under pressure during an active raise.
If you’d rather start from a solid foundation, our Startup Financial Model Templates are pre-built using this exact structure — driver tabs, monthly statements, valuation, sensitivity analysis, and dashboards — tailored across multiple industries, so you can plug in your own numbers and get an investor-ready model in hours, not weeks.
And if your business has a more complex structure — multiple revenue streams, marketplaces, or subscription tiers — our team can build a fully custom model with you. Explore our Financial Modeling Services to see how we work directly with founders to build investment-ready models from scratch.
Bottom Line
We’ve helped 100+ startups and built 500+ financial models across industries, and the pattern is always the same: clarity beats complexity, every time. If you’re ready to build yours, explore our Startup Financial Planning Templates or reach out for a custom financial model built around your business.
This article reflects insights from hands-on financial modeling work with 100+ startups across multiple industries. For more importance of why a solid model matters before fundraising, see our guide on the importance of a financial model template for startup success.
Frequently Asked Questions (FAQs)
A startup financial forecasting model is a structured spreadsheet that projects a company's future revenue, costs, cash flow, and profitability based on a set of business drivers — such as growth rate, pricing, and customer acquisition cost. Unlike a static budget, a good model is driver-based, meaning every output updates automatically when an underlying assumption changes, which makes it useful for fundraising, planning, and decision-making.
Building a complete startup financial model from scratch typically takes anywhere from a few days to two or three weeks, depending on business complexity and the number of revenue streams involved. A simple single-revenue-stream model can be built faster, while a multi-tab model with valuation, sensitivity analysis, and full financial statements usually takes longer to link and test properly. Using a pre-built startup financial model template can reduce this to a few hours, since the structure and formulas are already in place.
Business drivers are the key variables — like monthly growth rate, churn, pricing, customer acquisition cost, and headcount — that determine how a startup's financial outcomes change over time. Instead of hardcoding revenue or cost numbers directly, a driver-based model calculates them from these inputs, so changing one assumption automatically updates the entire forecast. This is why drivers are kept in a single, clearly labeled assumptions tab.
Investors care about driver-based models because they reveal the founder's underlying logic and assumptions, not just a final revenue number. A driver-based structure lets investors test their own scenarios, evaluate how realistic the growth assumptions are, and assess risk more accurately during due diligence — which is exactly how VCs evaluate a startup's financial model before deciding to invest.
Founders with solid Excel skills and a clear understanding of their business drivers can build a usable financial model on their own using a structured template. However, for fundraising-critical models — especially ones involving valuation, complex revenue streams, or multiple scenarios — hiring an FP&A consultant or financial modeling expert reduces the risk of broken links, formula errors, or unrealistic assumptions that can hurt credibility in front of investors.