

A founder once showed me his pitch deck with 40% month over month growth on the first slide, prominently displayed and in a large font. I asked him one question: ‘what does it cost you to get a paying customer, and what do they pay you back over the course of a year?’ He had no idea. Three months later, he was out of cash.
That’s the whole point of unit economics in a sentence, it doesn’t matter how fast you’re growing as long as you’re losing money on every additional customer you serve. I’ve built financial models for over 50 startups across the US, Kuwait, and the UAE, and this is the metric I always look at first before anything else before revenue, before the team slide, and before the product demo.
What is Unit Economics?
It starts with removing all the overheads and focusing on whether a single unit of whatever you’re selling makes economic sense on its own.
Your “unit” changes depending on what you sell, for instance;
- A business that sells subscriptions, a unit is one paying customer.
- For an e-commerce store, it’s one order.
- For amarketplace such as Uber or Airbnb, it’s one completed transaction.
Once you’ve isolated a unit, you can calculate its contribution margin to determine whether scaling it upwards benefits or hurts your business.
Why Founders Should Care more About Unit Economics Than Anything Else In Their Pitch
CB Insights once analyzed hundreds of post-mortems from failed startups and found that;
- 42% of them failed due to no market need.
- 29% failed due to running out of cash.
- 18% failed due to fundamentally unsustainable pricing or cost structures
Those three reasons are really different ways of expressing the same concern. If nobody wants your product, you’ll see that in the rising cost of customer acquisition, because you’ll constantly have to spend more to convince someone to buy from you. If you run out of cash, it’s because you scaled a business model that lost money on each sale, therefore accelerating your cash burn. And if your pricing structure is wrong, that’s a fancy way of saying you have terrible unit economics. There are more reasons why a business can fail than there are ways to measure its success, and unit economics is one of the few that can spot an impending disaster.
Key Components Of Unit Economics:
Unit economics isn’t a complex mystery; it’s a set of vital signs. When I sit down to build a financial model for a client—whether they are a tech startup in the US or a service provider in the Middle East. These are the specific organs of the business we examine to see if the company is healthy or failing.
Here are the key components you must track to ensure your startup is built to last.
Customer Acquisition Cost (CAC)
The Definition: It’s how much you spend to convince someone to buy from you.
Formula:
CAC = Total Marketing Expenses / Number of New Customers Acquired
- If CAC is High: This is a warning sign. It means your growth is expensive. If you spend $500 to get a customer who only spends $100, you are in trouble.
- If CAC is Low: This is the dream. It shows your marketing is efficient and your brand might be growing through word of mouth.
Customer Lifetime Value (LTV)
The Definition: LTV is the total profit a customer brings to your door before they stop using your service.
Formula:
LTV = Average Revenue Per User (ARPU) x Gross Margin % x Customer Lifespan
It’s a metric that shows investors the product’s ability to retain users. A high LTV generally correlates with a high gross margin, a strong gross profit, and therefore a better valuation. It also shows that a customer isn’t just using your product for a few days and then abandoning it. They’re sticking with you for months or even years.
Churn Rate
The Definition: It measures the percentage of customers who leave your service during a specific timeframe.
Formula:
Churn Rate = Customers Lost During Period / Total Customers at Start of Period
If your churn is high (anything over 5% monthly for a SaaS company is usually a red flag), it doesn’t matter how many new customers you get; you are losing them just as fast. Sustainability is built on retention, not just acquisition.
Average Revenue Per User (ARPU)
The Definition: This tracks the average amount spending to service/product per customer.
The Math:
ARPU = Total Revenue / Total Number of Customer
Increasing ARPU could mean improving your pricing strategy, encouraging more premium upgrades, or bundling additional products with your main one.
When I was working with Tadarab, we look for ways to increase ARPU through upselling or tiered pricing. If you can make more money from the same customer base, your profitability skyrockets without you having to spend a dime more on marketing.
Recurring Revenue (MRR & ARR)
The Definition: This is the predictable income you can count on every month (MRR) or every year (ARR).
Formula:
ARR/ MRR =Total Active Customers × Average Revenue Per User (ARPU)
Investors would rather have a steady income stream from your business every month than a few large payments. Predictable revenue is the cornerstone of sustainable and scalable growth, making valuation easier to calculate and more appealing to investors.
The LTV-to-CAC Ratio: The Ultimate Litmus Test
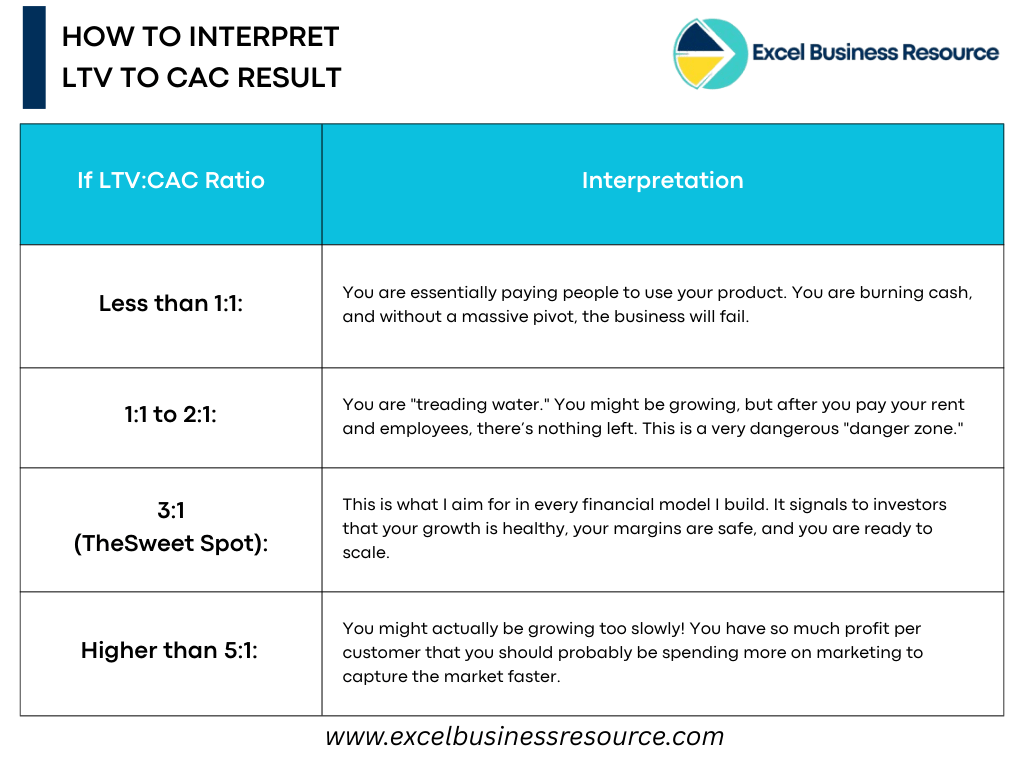
If I were to look at one metric this year to assess the health of a business, it would be this one. It asks the simple question: for every dollar you spend to acquire a customer, how many dollars do you make from them? If someone spends, say, $20 in ads to land a subscriber. They stay 10 months, paying $10 per month per user at a 60% gross margin, their LTV would be $60.
That’s a neat $60 ÷ $20 = a 3:1 ratio, which you can state to an investor as ‘give me a million dollars, and I’ll turn it into three million in customer value’.
Let’s say you want to run the numbers yourself instead of using my example. You can always download the free CLTV vs CAC excel sheet and plug in your own figures.
How To Interpret Most Important Unit Metrics: CLTV: CAC Ratio
How Key Metrics Should Look Like For Funding Startups
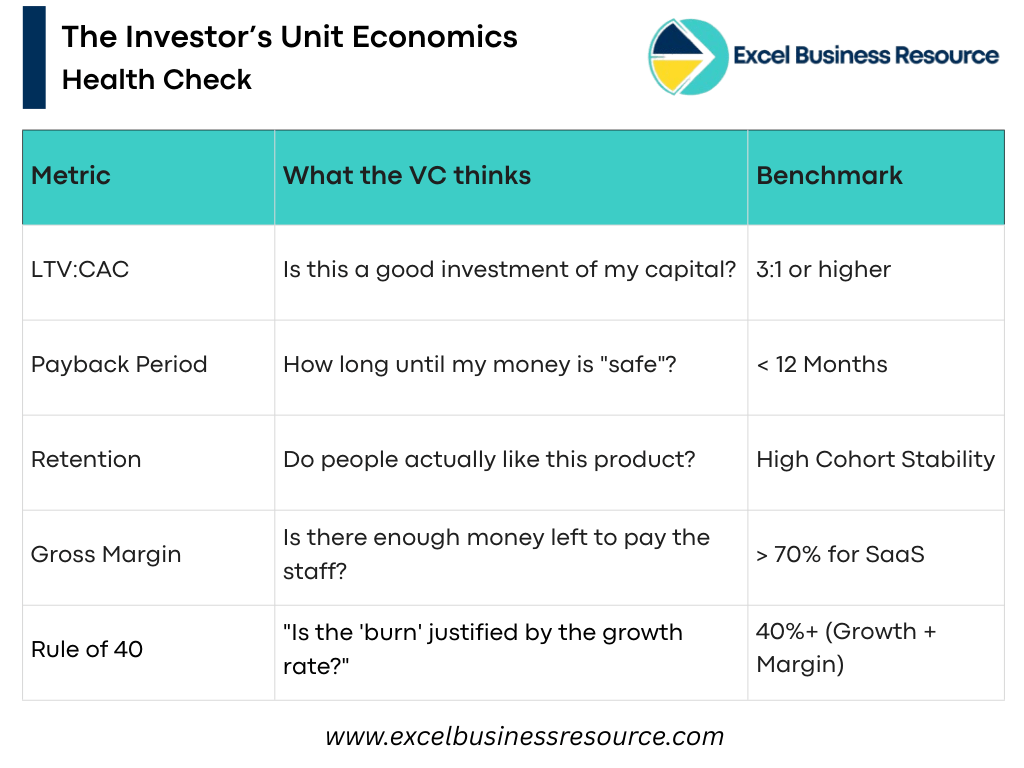
Most articles talk about LTV:CAC are written, the discussion usually revolves around the ‘healthy’ 3:1 ratio and stops there. But when it comes to fundraising, a 3:1 ratio is barely scraping by. To illustrate the difference between an average and a truly special startup, here’s a comparison of medians and best-in-class metrics:
| Metrics | Median (typical startup) | Best-in-class |
|---|---|---|
LTV:CAC ratio |
3:1 to 4:1 |
5:1 to 7:1+ |
CAC payback period (B2B SaaS) |
18 months (and rising) |
Under 12 months; elite teams hit 5–7 months |
Net Revenue Retention |
100–110% |
120%+ |
Monthly churn (SaaS) |
3–5% |
Under 2% |
Gross margin (SaaS) |
70% |
80%+ |
Figures compiled from Benchmarkit’s 2025 SaaS Performance Metrics report, OpenView Partners research, and industry NRR studies, 2025-2026
Why CLTV To CAC Ratio Matters Startup Valuation:
Investors value efficiency as much as revenue when it comes to a company’s ability to sustain itself. A high LTV:CAC ratio proves three things to an investor at once:
- There’s product-market fit
- The marketing channels are healthy
- The company has room to absorb rising costs without panicking.
Two companies can report the same revenue, but the one with a 4:1 ratio has a significantly higher valuation than the one with 2:1, simply because it has more breathing room. When speaking to a founder about a raise, this is the number we always build the conversation around.
How Key Metrics Of Startups Impact Valuation & Fundraising
Not all revenue is valued the same by an investor’s spreadsheet.
When I work on valuing startup using multiple methods, unit economics are the first thing we look at to determine the EBITDA Multiples & Revenue Multiples.
1. The Quality Of Revenue
Revenue from high-margin, low-churn customers earns you a real multiple (8x, 10x, etc.), whereas revenue from customers who churn out in three months gets you valued on your assets versus your growth story.
2. Efficiency Is Competitive Advantage
Investors look for Capital Efficiency. If you can prove that $1 of investment results in $4 of Lifetime Value, you become an irresistible target for funding.
3. Scalability vs. Growth
Scalability isn’t the same thing as growth, even though founders use them interchangeably. Growth is just a bigger number on a slide. Scalability means revenue grows faster than costs. Unit economics prove that, and without it, you’re just inflating your burn rate and hoping nobody notices.
How Investors Analyze Unit Economics Of Startups:
1. The Cohort Analysis: Finding The Leaks
VCs don’t really care about your total user base, they care about cohorts, or a group of users who joined in the same month throughout the year.
If the January cohort is still paying you happy money but the June cohort is churning out fast, there’s something obviously wrong, and it’s worth investigating. Often, your first hundred customers are true fans who found you naturally. By customer ten thousand, you may be paying to find people who barely need your product, and your unit economics quietly worsen the bigger you get. VCs want to see retention holding steady or improving across your newer cohorts not a slow leak that nobody is talking about.
2. Marginal Contribution: The Law of Diminishing Returns
If your CAC is $10 today, will it still be $10 to get your thousandth customer? Almost never. Once you’ve exhausted your best channels, your marginal CAC starts climbing.
What the VC is really asking with this question is whether your business model can remain profitable even if CAC doubles. It’s a question about operating leverage whether your fixed costs stay flat while your unit profit eats up the higher acquisition cost, or if the whole model collapses.
3. The Payback Period vs. Burn Rate
Investors use your unit metrics to calculate your Runway.
An 18-month payback period sounds healthy on its own, until you realise you only have 12 months of cash on hand and are about to run out of money before your own customers finish paying you back.
If you haven’t mapped this out precisely, start with the free startup cash runway template. It only takes ten minutes to fill in and tells you how many months you have before you need to raise again.
4. Expansion Revenue: The “Negative Churn” Holy Grail
The best unit economics don’t just survive, they thrive and grow on their own. That’s known as Net Revenue Retention.
This is a magic version of it is negative churn, where a customer who used to pay you $10 last month pays $12 this month through upsells alone. Reach that, and you’ve grown your business even without acquiring a single new customer. It’s the strongest signal a startup can send an investor.
How to Improve Broken Unit of Economics:
If your current numbers aren’t where they need to be, don’t panic. Unit economics are not static; they are the result of the choices you make every day as a founder. There are three main levers you can pull to transform a struggling startup into a profit machine.
1. Optimize Your Pricing (The LTV Booster)
Founders are rightly terrified at the thought of alienating their customers, but it rarely works out. If your margin is low, a 10% increase can double your profit, since costs remain the same while the additional revenue drops straight to the bottom line.
2. Fix Churn Before Getting New Customers:
Keeping an existing customer costs roughly a fifth of what it costs to win a new one. Fix your onboarding first. Stretch the average customer lifespan from 12 months to 24, and you’ve doubled your LTV without spending a penny on marketing.
3. Build Referral Loops (The Viral Coefficient)
If every happy customer brings you one additional for free, your blended CAC drops by half overnight. Dropbox and Slack didn’t out-spend their competitors on marketing – they turned their existing users into a free acquisition channel, which then compounded.
VCs do invest in loss startups, because of rule of 40 which makes them trust in future profitability. I understand this sound vague, but that’s true.
Read this article: What is Rule of 40: A Guide to Balancing Growth and Profitability and you will get your answer.
How Founders Can Trace and Optimize Unit Economics
As a financial modeler, I always tell my clients: “You cannot manage what you do not measure.” If you want to reach the level of a Zomato or an Uber, you need a system to track these numbers in real-time. Therefore, I recommend the following tools for analyzing your metrics.
- For SaaS: Tools like ProfitWell or Baremetrics are essential. They plug directly into your payment gateway (Stripe/PayPal) and give you a live dashboard of your Churn, LTV, and MRR.
- For E-commerce: Use Glean or TripleWhale. These tools help you see your “Contribution Margin” after ad spend, shipping, and COGS are subtracted.
- Early-stage founders don’t need expensive software yet. A solid startup financial model built for your industry lets you run “what if” scenarios by hand, such as testing what happens to your runway if CAC drops by 10%. Growth-stage companies usually outgrow generic templates fast.
- A custom financial forecasting model lets you stress-test dozens of variables at once and answer the question “what happens to our valuation if churn rises 1%?” instead of guessing.
Learn: How to build SaaS financial model from scratch
Learn: How o built startup financial forecasting model from scratch
Real-World Case Studies: How Unit Economics Can Make or Break a Startup
Netflix – The Mastery of the “LTV-to-Content” Loop
Netflix is the ultimate example of a company that used high debt to fuel growth because their unit economics were incredibly predictable.
- The Unit: A single monthly subscriber.
- Customer Lifetime Value (LTV): While Netflix spends billions on content (appearing “in the red” on a cash flow basis), but their Churn Rate has historically been among the lowest in the streaming industry (often under 2-3%). Because subscribers stay for years, their LTV is massive compared to their acquisition cost.
- The CAC Factor: Netflix’s CAC is high because they must constantly market new originals content. However, because they own the global rights to their content, the Marginal Cost of serving one additional user is nearly zero.
- Takeaway: Netflix proved that as long as your LTV:CAC ratio stays high and your churn stays low, you can afford to take on billions in debt to buy more market share.
MoviePass – The Fatal “Negative Margin” Trap
MoviePass is a textbook case of what happens when your unit economics are fundamentally broken from day one.
- The Unit: A single monthly subscriber ($9.99/month).
- The Mathematical Flaw: MoviePass paid theaters the full retail price for every movie ticket a subscriber used. If a user in NYC saw just one movie, MoviePass paid ~$15.00 for a ticket they only received $9.99 for.
- The Inverse Scale: In a healthy startup, scaling lowers costs. In MoviePass’s case, scaling increased losses. They had a Negative Contribution Margin. For every new customer they acquired, they lost an average of $5 to $20 per month.
- Takeaway: No amount of “growth” or “data collection” can save a business where the product costs more to deliver than the price it’s sold for. Growth only accelerated their bankruptcy.
Uber – Pivoting from Subsidies to Efficiency
Uber’s early years were defined by buying the market, but they successfully evolved their unit economics to reach profitability.
- The Unit: A single trip or delivery.
- The Efficiency Pivot: Originally, Uber spent heavily on Driver Incentives (essentially a high CAC for the supply side). To fix this, they introduced:
- UberPool: This allowed them to put multiple “revenue units” (riders) into a single “cost unit” (one driver/one car), drastically improving the margin per trip.
- UberEats: By using the same driver network for food, they increased the Utilization Rate. A driver who was idle between passenger trips could now deliver food, spreading the “cost of the driver” across more transactions.
- The Result: By stacking multiple services (rides, freight, food) onto one infrastructure, they lowered their blended CAC and increased the LTV of every person on the platform.
- Takeaway: If your initial unit economics are shaky, you must find ways to increase Asset Utilization or stack revenue streams to make the unit profitable.
Conclusion: Don’t Build Startup On Sand
Unit economics form the foundation of everything else in your company. Whether you’re building an AI product or a local service business, the math has to work on a single unit before you scale it. If you are a founder looking to raise your next round or simply want to know if your business is truly profitable, don’t guess. Use a structured financial model to validate your assumptions.
I’m Hammad Hasan, and I’ve helped hundreds of founders turn their “units” into millions. Visit excel business resource to download our latest financial modeling templates and start building your startup on a foundation of solid math.