
Every founder builds a forecast. Few founders can explain why their revenue line goes up the way it does. That gap between having a forecast and understanding the engine behind it, is exactly what business drivers are meant to close.
Business drivers are the specific, measurable inputs (website visitors, conversion rate, sales reps, average order value, churn, production capacity) that actually impact your revenue, costs, and cash balance to move. If you can’t name yours, you don’t have a financial model, you have a guess with a currency symbol attached.
For a startup, this isn’t an academic exercise. CB Insights‘ analyzed more than 400 VC-backed startups failer root cause,
- 70% of startups “ran out of capital, but the real story sits one layer beneath
- 43% startups failed due to poor product-market fit.
- 29% startups failed due to bad timing.
- 19% startups failed due to unsustainable unit economics
If analyzed deeply, not knowing the business drivers and it’s impact were the actual root causes that drained the cash.
Running out of money is the symptom. Not knowing your drivers is the disease.
What Are Business Drivers?
A business driver is an operational metric that has a direct and traceable cause-and-effect relationship to a line item on your financial statements. Corporate Finance Institute talks about a business driver as a key input and activity that drive a company’s operational and financial results; the way to find them is to keep asking “what causes this number to move?” up until you hit something you can actually control or measure.
Take a SaaS startup. Revenue doesn’t move on its own, it only moves because:
- Website visitors increase or decrease
- A certain percentage of those visitors convert to trial users
- A certain percentage of trial users convert to paying customers
- Customers churn at a certain monthly rate
- Average revenue per customer rises or falls
Each of these is a SaaS business driver. None of them is revenue itself, revenue is the output. The drivers are the inputs. This is the core idea behind driver-based forecasting: instead of typing in “revenue grows 20% next year” as a magical assumption, you build the number up from the ground using the metrics that generate it. If you want a deeper walkthrough of this process, our guide on driver-based forecasting walks through the whole build.
What Are Some Examples of Business Drivers?
Drivers vary depending upon the industry, but most often, startups track a combination of the following:
- Number of website visitors or footfall (visitors/customers visiting you)
- Conversion rate (visitors who become paying customers)
- Number of salespeople and their productivity
- Average price for units or subscriptions
- Units, orders, or transactions
- Customer churn rate and retention rate
- Production capacity or fulfillment rate
- Cost per employee, rent, and other overheads
- Customer acquisition cost (CAC) and lifetime value (LTV)
- Foreign exchange rates or input/commodity costs, for businesses dealing with them
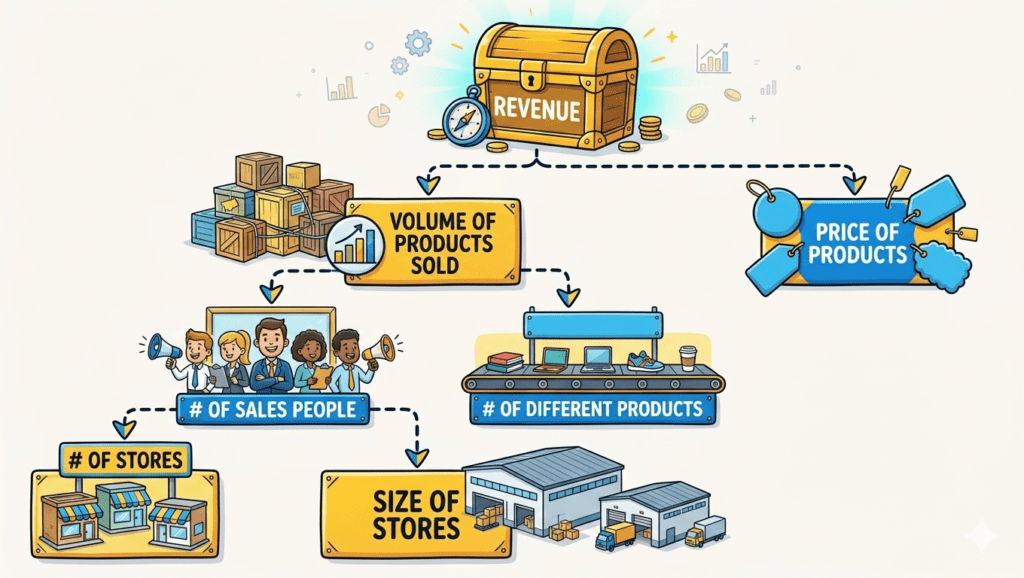
A good rule of thumb is that any metric which can be increased/decreased by a decision or operational change (increasing ad budget, changing price, hiring more people) and not determined solely by a different driver is a driver. By contrast, a metric that only changes when another metric is changed is an output, such as revenue or net–profit.
How Do You Determine Your Startup's Business Drivers?
Instead of tracking 40 metrics, you track the 5-8 that actually drive your financial statements. Here’s how we do it at a founder level:
- Start at the financial statement, not the spreadsheet. Pick a line item revenue, COGS, payroll and ask “what causes this to change?”
- Keep asking “what causes that?” until you reach something operational and controllable, like number of stores, sales headcount, or production capacity. That’s your core driver.
- Separate revenue drivers from cost of revenue drivers. Common revenue drivers are traffic, conversion rate, pricing, units and churn. Common cost drivers are headcount, infrastructure spend, price of raw materials and fulfillment cost per unit.
- The most important drivers to track are not the easiest ones to track, but the ones that have the highest leverage on your business. A one percent improvement in churn could easily be more valuable than a one percent improvement in traffic. Identify the two or three levers that have the biggest impact on your financials.
- Build your financial model around drivers, not outcomes
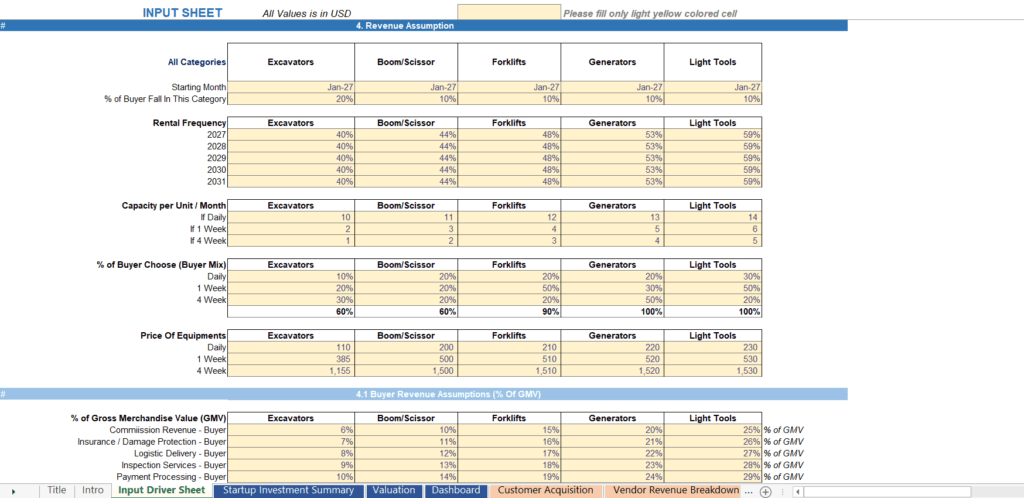
- Once you‘ve identified your drivers, your financial model is just a set of equations that turn those drivers into financial statements.
Repeat this process for revenue streams, cost of goods sold and operating expenses – the drivers for each are likely to be different.
Still wondering why financial forecasting is so important? Start by reading our article on the importance of financial modeling for startups.
Once you have identified your key business drivers, the next step is to turn those assumptions into a structured business drivers & prepare financials. The best way to do this is by building a financial forecasting model in Excel.
If you are confuse how to do it, then, have a look at our another article, you’ll learn the complete step-by-step process of creating a investor ready startup financial model the way investors expect to see it. Whether you’re launching a SaaS company, eCommerce business, marketplace, or any other startup, the principles remain the same.
If you have a finance background and are comfortable with Excel, forecasting, and valuation techniques, you can build a solid model yourself. However, if you’d rather save time and focus on growing your business, our team can create a professional startup financial model tailored to your needs.
Why Investors Reject Revenue Assumptions Of Startups?
Most early-stage models fail not because the founder used the wrong formula, but because the assumptions feeding the formula have no operational backbone. “We’ll grow 15% month-over-month” is not a driver. It’s a hope dressed up as a number.
A model built on business drivers lets an investor stress-test your business the way they actually evaluate deals. For example, an investor can quickly ask:
- What happens to revenue if conversion rate drops by 2 points?
- What happens to burn if customer acquisition cost rises 30%?
- How long is the runway if churn increases from 3% to 5% monthly?
If your model can answer these in seconds because it’s driver-based, you look like a founder who understands their own business. If it can’t, you look like a founder reciting a spreadsheet someone else built.
This matters more than founders expect during fundraising. VCs aren’t just buying your story — they’re buying your unit economics. Concepts like CAC, LTV, payback period, and gross margin per unit are themselves downstream of your business drivers, and they’re central to how investors size up scalability. If those terms are new to you, our breakdown of unit economics explains how they connect directly to startup valuation.
What Business Assumptions Drive Revenue in Each Industry?
Because drivers vary by business model, here’s how they typically break down:
- SaaS/subscription: website visitors, trial signups, trial-to-paid conversion rate, monthly churn, average revenue per user (ARPU)
- E-commerce/D2C: ad spend, click-through rate, conversion rate, average order value, repeat purchase rate
- Marketplace: number of active buyers and sellers, take rate, transaction frequency
- Brick-and-mortar/retail: number of locations, foot traffic, conversion rate, average transaction size, sales staff productivity
- Services/agency: number of active clients, average contract value, utilization rate per employee
These are the business assumptions that drive revenue in each model, and they’re exactly the inputs that belong in your assumptions tab.
Why Do Business Drivers Matter More When Cash Is Tight?
When startup funding tightens, every dollar of runway has to be defensible. A driver-based model doesn’t just forecast revenue it tells you, in real time, which lever to pull when growth slows: do you need more traffic, a better conversion funnel, or lower churn? Without that visibility, founders tend to cut broadly (and painfully) instead of precisely. Pairing your driver-based model with a cash runway template gives you both the forecast and the early-warning system in one view. It is exactly the kind of discipline investors look for before they commit a term sheet.
It’s also why more experienced founders bring in outside support before their first real fundraising round. An FP&A consultant can help scale your startup by translating raw operational data into the driver structure investors expect to see rather than a generic template stretched to fit.
How Do Business Drivers Affect Startup Valuation?
Drivers doesn’t just feed your P&L, they directly shape how your company gets valued. Whether an investor is using a DCF valuation, a revenue multiple, or comparing your business against an EBITDA multiple valuation, every method ultimately depends on the credibility of your forecast. A forecast built on real operational drivers is far easier to defend during diligence than one built on a flat growth percentage pulled from a competitor’s pitch deck. If you’re preparing for a raise, it’s worth reviewing the different startup valuation methods so you know which one your investor is likely to apply and what drivers that method will scrutinize hardest.
If you want to find valuation of your startup the way VCs does, then use startup valuation calculator for quick valuation & analysis.
Build Your Startup Financial Projection Model
Identifying your business drivers is the foundation. The next step is putting them inside a model that links assumptions to a full three-statement output, so every change in a driver flows automatically into revenue, cash, and runway. That’s precisely what our startup financial model templates are built for investor-ready, driver-based, and structured by industry, so you’re not retrofitting generic formulas to your business. Whether you need a SaaS model, an e-commerce model, or a services model, starting from a driver-based structure saves weeks of rework and signals to investors that your numbers are grounded in operations, not optimism.
The Bottom Line
Business drivers are the difference between a forecast that survives investor diligence and one that collapses under the first hard question. They’re not a financial modeling buzzword, they’re the operational truth your financial statements are built on. Startups that identify and track the right drivers don’t just forecast better; they make sharper decisions, defend their valuation more credibly, and extend their runway further than founders relying on top-down growth assumptions.
If you’re forecasting your startup’s future, start with the drivers not the spreadsheet formulas. Get that right, and everything downstream, from your model to your fundraise, gets easier.