

Executive Summary: BESS Cost & Return Benchmarks at a Glance
For project developers, institutional investors, and facility managers, evaluating a Battery Energy Storage System (BESS) comes down to clear key performance indicators (KPIs) and initial capital demands. The table below summarizes the key financial metrics for 2026 deployments:
| Financial & Technical Metric | Commercial & Industrial (C&I) | Utility-Scale (Grid-Connected) |
|---|---|---|
|
Typical System Scale |
500 kW / 1 MWh – 2 MW / 4 MWh |
10 MW / 40 MWh – 100 MW+ / 400 MWh+ |
|
Turnkey Installed Cost ($/kWh) |
$650 – $900 / kWh |
$350 – $480 / kWh |
|
Average Total CAPEX Range |
$650,000 – $1.8 Million |
$14.0 Million – $19.2 Million (per 10MW/40MWh) |
|
Annual Operating Expense (OPEX) |
2.0% – 3.0% of Initial CAPEX |
1.5% – 2.5% of Initial CAPEX |
|
Mid-Life Battery Augmentation |
Year 8 – 10 (~15% to 20% of hardware) |
Year 7 – 10 (~15% to 25% of hardware) |
|
Unlevered Project IRR |
7.5% – 11.0% |
8.5% – 13.5% |
|
Levered Equity IRR |
10.0% – 15.0% |
12.5% – 18.5%+ |
|
Simple Payback Period |
6 to 9 Years |
5 to 8 Years |
|
Dominant Cell Chemistry |
LFP (Lithium Iron Phosphate) |
LFP (Lithium Iron Phosphate) |
BESS Project Cost & Profitability
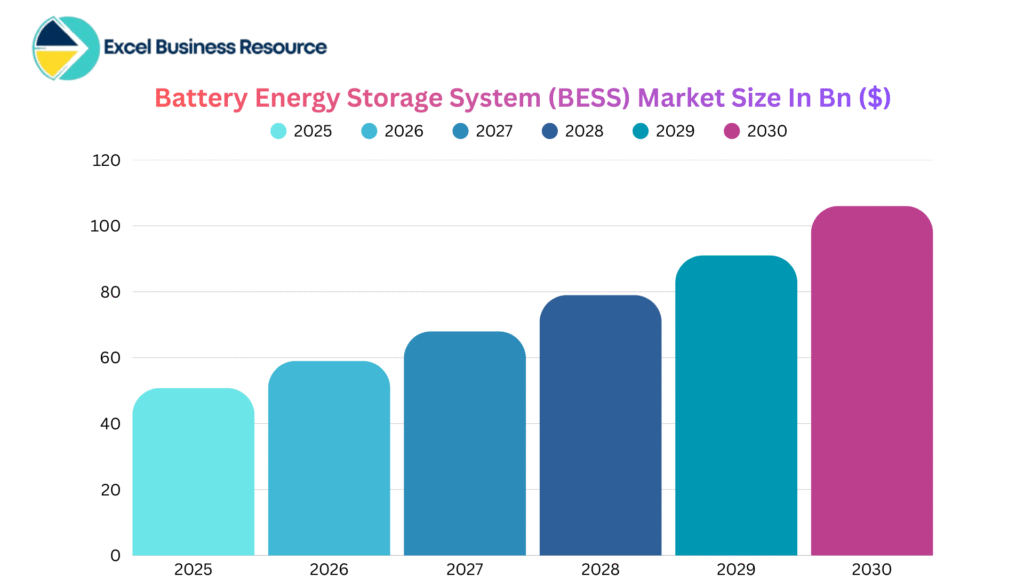
Creating a Battery Energy Storage System (BESS) is now not only an exercise in sustainability but a capital-intensive venture. With rising demand in power grid modernization, the world-wide BESS market size is surging, and private equity funds, renewable developers, and industrial players are all investing significantly in storage assets.
Whether you are a commercial facility manager, trying to reduce peak demand charges or a fund manager, considering a 100 MW site acquisition, the most pressing question is clear: How much capital will I have to shell out to get electrons flowing in my BESS, and when will I see a return on this investment?
A turnkey BESS costs $350 and $900 per Kilowatt-hour (kWh) installed anywhere from 350 USD/kWh to 500 USD/kWh, depending on the storage duration, system scale, voltage integration needs, and civil engineering specifics.
Below are the CAPEX, OPEX, battery capacity degradation calculations, project payback timelines, and valuation multiples for 2026.
1. Capital Expenditure (CAPEX): How Much Does BESS Cost Upfront?
CAPEX for battery storage depends heavily on economies of scale. A 2-hour commercial system carries a significantly higher per-unit capital cost than a 4-hour grid-scale asset due to procurement volume efficiencies, standardized containerization, and spread-out engineering overheads.
Turnkey Installed Cost Benchmarks
Utility-Scale Systems (10 MW / 40 MWh to 100 MW+):
Turnkey Unit Cost Range: $350 – $480 per kWh (All-in EPC)
Total Estimated Capital: $14.0 Million – $19.2 Million (for a benchmark 10 MW / 40 MWh 4-hour system)
Commercial & Industrial (C&I) Systems (500 kW / 1 MWh to 2 MW / 4 MWh):
Turnkey Unit Cost Range: $650 – $900 per kWh (All-in EPC)
Total Estimated Capital: $650,000 – $900,000 (for a standard 1 MWh 2-hour C&I deployment).
Source Reference:
2. Line-Item CAPEX Breakdown:
When energy project developers inspect an EPC proposal, the battery enclosure racks represent only a fraction of the total invoice. A bankable BESS CAPEX budget breaks down into five core structural categories:
| BESS CAPEX Allocation | Range |
|---|---|
|
Battery Modules & Racks (LFP) |
45% – 52% |
|
Balance of Plant (BOP) & Civil |
14% – 18% |
|
Power Conversion (PCS) & BMS |
12% – 16% |
|
EPC, Interconnection & Permitting |
12% – 16% |
|
Developer Fees & Contingency |
5% – 8% |
Detailed Breakdown of Cost Allocation:
Battery Modules & Enclosures (45% – 52% of CAPEX): Includes the direct procurement of Lithium Iron Phosphate (LFP) cells, module racks, internal cabling, and pre-integrated containerized enclosures. LFP technology has almost entirely replaced Nickel Manganese Cobalt (NMC) in stationary storage due to a 15–20% lower cost per cycle, longer lifespan (6,000+ cycles), and superior thermal safety profiles.
Power Conversion System (PCS) & BMS (12% – 16% of CAPEX): Covers bi-directional inverters that convert DC energy from batteries to AC power for the grid, medium-voltage step-up transformers, and the primary Battery Management System (BMS) software responsible for cell balancing and fault detection.
Balance of Plant (BOP) & Civil Works (14% – 18% of CAPEX): Covers site preparation, concrete foundation pads, HVAC and liquid thermal management systems, fire detection and suppression equipment (NFPA 855 compliance), auxiliary power, and site security fencing.
EPC, Interconnection & Permitting (12% – 16% of CAPEX): Covers high-voltage grid interconnection studies, utility substation upgrades, environmental impact assessments, local fire marshal permits, structural engineering design, and site construction labor.
Development Fees & Contingency (5% – 8% of CAPEX): Essential financial reserves for unexpected civil ground conditions, supply chain delays, construction insurance policies, legal fees, and project finance structuring expenses.
3. Operational Expenditure (OPEX) & Battery Augmentation
Operating a BESS asset is not passive. Unlike solar PV installations with static panel setups, battery systems experience physical chemical degradation every time energy is cycled through the cell matrices.
Annual Fixed and Variable Operating Costs
Ongoing operational expenses typically range between 1.5% and 2.5% of initial CAPEX per year for utility assets (and up to 3.0% for C&I systems). For a $10 Million utility installation, expect an ongoing operating budget of $150,000 to $250,000 per year, covering:
Preventative Maintenance & HVAC Servicing: Regular inspection of liquid cooling lines, inverter filters, thermal sensors, and switchgear connections.
Insurance Premiums: Property damage, fire coverage, and business interruption insurance—now heavily scrutinized by underwriters.
Site Land Lease & Taxes: Ground leases for utility plots or commercial facility floor space allowances, alongside local property taxes.
Asset Management & Energy Management System (EMS) Software: Software licenses for AI-driven bidding platforms, market dispatch optimization, and continuous remote telematics.
The Critical Hidden Cost: Battery Capacity Augmentation
Batteries degrade over time. A system cycling once or twice daily under standard thermal conditions will typically degrade to 70%–80% of its initial rated capacity by Year 7 to Year 10.
If your project holds a 15-year capacity agreement with a utility or grid operator, you cannot afford capacity drop-off. Developers must plan for Battery Augmentation adding new battery strings or swapping degraded racks mid-way through the project lifecycle.
Augmentation Financial Reserve: Developers should budget 15% to 25% of the original battery hardware cost in a sinking fund or model it as a major mid-life capital expenditure between Years 7 and 10.
4. Financial Returns, Revenue Stacking, and Investment KPIs
Evaluating the overall feasibility of a storage facility requires analyzing both cost controls and dynamic revenue streams. Modern battery projects rely on “revenue stacking” combining frequency regulation, capacity payments, and arbitrage to maximize project yields. For a granular analysis of how these income streams operate, review our detailed guide on BESS revenue drivers breakdown.
Core Investment Metrics:
Simple Payback Period: 5 to 8 years in power markets with high electricity price volatility or steep commercial demand charges.
Unlevered Project IRR: 8.0% to 13.5% (reflecting raw cash flow yields before debt).
Levered Equity IRR: 12.5% to 18.5%+ (assuming conservative project finance debt structuring).
When pitching your project to debt lenders or institutional equity partners, numbers alone are not enough; you must track the specific operational and financial metrics that drive credit decisions. Make sure to review the top 10 KPIs of Battery Energy Storage System (BESS) business that investors actually care about, including Round-Trip Efficiency (RTE), Debt Service Coverage Ratio (DSCR), and degradation-adjusted IRR.
Furthermore, if you are currently compiling your pitch materials or loan application packages, follow our step-by-step framework to write a profitable BESS business plan for investors to ensure your project narrative aligns with institutional bankability standards.

Turn Your BESS Concept Into Bankable Financial Projections
Back-of-the-envelope estimations and generic cost ranges will not satisfy bank credit committees or equity investors. Building a bankable BESS business case requires capturing complex, interconnected variables from revenue stacking mechanics and capacity degradation curves to round-trip efficiency losses and levered debt service waterfalls.
Save weeks of custom financial engineering with our Battery Energy Storage System (BESS) Financial Model Excel Template.
Key Features of the Financial Model:
30-Year Monthly & Annual Financial Statements: Fully integrated Income Statement, Balance Sheet, and Cash Flow Statement tailored for energy storage assets.
Granular CAPEX & OPEX Schedules: Dynamic inputs for battery hardware, PCS, balance of plant, EPC fees, land lease, insurance, and maintenance reserves.
Degradation & Augmentation Engine: Automated capacity degradation modeling linked directly to annual cycle counts, with built-in battery augmentation capital budgeting.
Investor-Ready Outputs: Automated Discounted Cash Flow (DCF) valuation, Levered and Unlevered IRR, Net Present Value (NPV), Payback Period, and Debt Service Coverage Ratio (DSCR) waterfall calculations.
Download the Investor-Ready BESS Financial Projection Model Today
Frequently Asked Questions (FAQs)
What is the average cost per kWh for a utility-scale BESS in 2026?
The fully installed turnkey cost for a utility-scale BESS averages between $350 and $480 per kWh for a standard 4-hour system. This includes battery racks, power conversion systems, balance of plant, civil engineering, and grid connection fees.
Why are commercial (C&I) battery projects more expensive per kWh than utility-scale systems?
C&I projects lack economies of scale. Fixed costs for specialized site engineering, custom facility integration, switchgear, and safety permitting are spread over a much smaller energy capacity (e.g., 1 MWh vs 100 MWh), resulting in higher unit costs of $650–$900/kWh.
How does battery degradation impact BESS project profitability?
Degradation directly reduces available discharge capacity over time. Unmodeled degradation leads to revenue shortfalls in Years 5 through 10, lowering the project’s Internal Rate of Return (IRR) and risking breach of debt covenants.
What is BESS capacity augmentation, and why must it be budgeted?
Augmentation is the scheduled addition of fresh battery strings or rack replacements mid-way through a project’s life (typically Year 7–10) to restore lost storage capacity and maintain contractual performance guarantees with grid operators.
What is the typical lifetime of a commercial or utility BESS project?
While individual battery cells typically degrade to end-of-life thresholds within 10 to 12 years (depending on cycle count and temperature), the overall BESS project infrastructure (enclosures, civil foundation, transformers, grid connection) is designed for a 20 to 25-year operational lifecycle when paired with planned augmentation.