Free Sales Forecasting Template

A simple, ready-to-use Sales Forecasting Template built as a clean 3-year, month-by-month Revenue Forecasting Template for startups selling multiple products across more than one market. This pre-built Sales Planning Excel Template turns your product volumes, pricing, and costs into a complete, investor-ready sales forecast automatically.

  • Up to 5 Products per Region, Fully Customizable
  • 3-Year Monthly Forecasting Timeline (36 Months)
  • Detailed Unit Economics — Units Sold, COGS, Unit Price & Margin per Unit
  • Automated Revenue & Gross Profit Calculations
  • Two-Region Structure for Multi-Market or Multi-Channel Planning
  • Auto-Calculated Consolidated Revenue Forecast Tab
  • Bottom-Up, Product-Level Detail — Not Just a Flat Growth Number
  • Fully Editable, Not Password-Protected

$0.0

✅ Trusted by 2,000+ Founders & Investors Worldwide

Why Choose Our Free Sales Forecasting Template

Startups have used our financial model templates to raise up to $5 million in Series A capital and seed funding. These models were developed by FMVA-certified professionals. We have worked with over 50 businesses and created more than 500 financial forecasting and valuation models for startups.

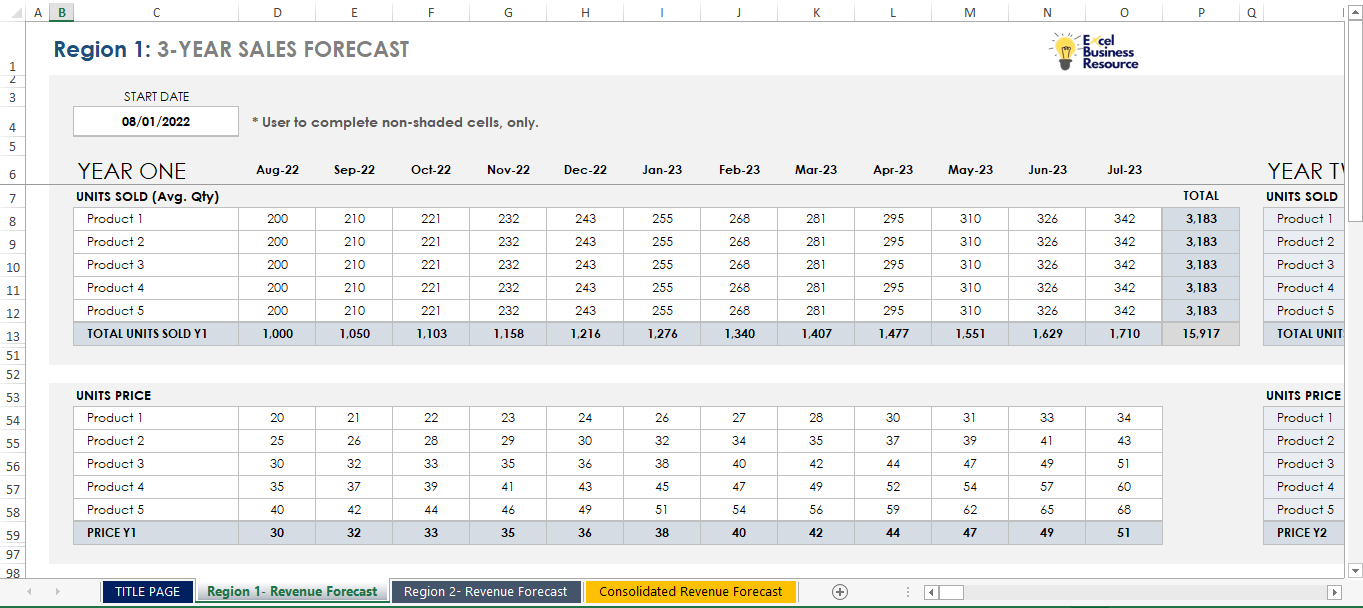
Spreadsheet displaying a detailed sales forecasting template with tables for monthly revenue, product categories, and projected growth rates.

Description

Sales Forecasting Template for Founders

Investors and lenders almost always ask the same question first: “What does your revenue growth actually look like?” This Sales Forecasting Template for Founders gives you a simple, ready-to-use way to answer that — a clean 3-year, month-by-month Revenue Forecasting Template built for startups selling multiple products across more than one market.

No complex formulas to build, no guesswork on structure. Just plug in your product volumes, pricing, and costs, and the model builds your full sales forecast automatically — by product, by region, and consolidated.

This is a Sales Planning Excel Template designed around how early-stage companies actually sell: multiple products, sold in multiple regions, at prices and volumes that change month to month as the business grows. Instead of a single flat revenue line, this template lets you build a realistic, bottom-up forecast that shows exactly how each product and each region contributes to total revenue and gross profit.

It's built to be simple enough to fill in during a single planning session, yet detailed enough to stand behind in an investor deck or lender application.

The workbook is organized into 4 tabs, kept intentionally lean so you're never lost in the file:

  1. Title Page – quick orientation on how the workbook is structured
  2. Region 1 – Revenue Forecast – full 3-year, monthly sales forecast for your first market
  3. Region 2 – Revenue Forecast – a mirrored forecast structure for a second market or sales channel
  4. Consolidated Revenue Forecast – an automatically calculated roll-up of both regions (this tab is formula-driven and not meant to be manually edited)

This regional structure makes it easy to answer investor questions like "how much of your revenue comes from Region 1 vs. Region 2?" without building separate spreadsheets.

Each region tab tracks up to 5 products, projected monthly across a full 3-year timeline (Year One, Year Two, Year Three), so you get 36 months of forward-looking sales data per region.

For every product, you can input and forecast:

  • Units sold (average monthly quantity) — model how sales volume grows or changes over time
  • Unit cost of goods (COGS) — your per-unit production or purchase cost
  • Unit price — your selling price per product
  • Margin per unit — automatically calculated from price minus COGS
  • Revenue — units sold × unit price, calculated automatically for every month
  • Gross profit — margin per unit × units sold, rolling up to a total gross profit figure per year

Each section automatically totals "TOTAL UNITS SOLD," "TOTAL REVENUE," and "TOTAL GROSS PROFIT" for the year, so you always have a running total without building your own SUM formulas.

A lot of early sales forecasts are just "we'll grow 10% month over month" — which rarely survives investor diligence. This template forces (and helps) you build something more defensible:

  • Product-level detail — shows exactly which products drive revenue and margin, not just a top-line number
  • Regional breakdown — useful for startups expanding into a second market, launching a new sales channel, or comparing domestic vs. international performance
  • Built-in unit economics — margin per unit and gross profit are calculated automatically, so you can immediately see which products are actually profitable
  • Consolidated view — the Consolidated tab automatically merges both regions, giving you one clean number for pitch decks without manual reconciliation
  • Simple, ready-to-use structure — enter your assumptions once and the monthly, yearly, and consolidated totals update automatically
  • 3-year monthly timeline — enough runway to support seed-to-Series-A planning conversations
  • Covers up to 5 products per region — enough granularity for most early-stage product lines without overcomplicating the file
  • Two-region structure — model separate markets, channels, or business units side by side
  • Auto-calculated consolidated tab — no manual copy-pasting or re-adding of totals across regions
  • Not password-protected — fully editable so you can add products, adjust the timeline, or extend it further
  • Startup founders preparing revenue projections for an investor pitch deck
  • Early-stage companies selling multiple products across more than one market
  • Founders who need a Sales Planning Excel Template they can update monthly as actuals come in
  • Anyone building a business plan who needs a defensible, bottom-up sales section rather than a flat growth assumption

Reviews

There are no reviews yet.

Only logged in customers who have purchased this product may leave a review.

Get started with our​ Free Sales Forecasting Template

What Our Clients Say

Frequently Asked Questions

Everything you need to know about our projection templates.

Absolutely! Each model has user-friendly interface, clear instructions, and pre-built formulas to help even those without advanced financial expertise use it effectively.


Complete 5 to 10-year projections, with detailed assumptions, revenue forecasting, 3 financial statements, break-even analysis, advanced valuation, investor-ready reports, cost calculations, KPI summaries, and optional customizations.


The template is fully compatible with Microsoft Excel & Google Sheet.

Yes, we offer fully customizable templates to fit your specific business needs. If you require additional changes, we also provide customized services—just contact us to discuss your requirements.

We offer a 7-day 100% money-back guarantee. If you’re not satisfied with the model, simply let us know within this period for a full refund.

If you encounter any errors, we’ll rectify them free of charge. Our commitment is to deliver an error-free and reliable financial model for your business.

Each Model is designed for specific industry & according to their revenue model. Therefore browse industry model’s title & read description available in Financial Model Templates Page. However if you requires customized template then please email us, we would love to assist you.

Absolutely! We provide email support to assist you with any questions or issues you may have while using the financial model.


Customized Spreadsheets

Tailored to met your unique financial needs.

Comprehensive Training

Empowering you to use models effectively.

Accurate Projections

Make informed decisions with confidence.

We prepare comprehensive business plan to launch and grow startup with;

Data-Driven Market Research

Detailed market analysis and SWOT insights

Business Model Canvas

Clear visualization of your business structure

Financial Projections

Valuation and forecasts to showcase your potential