
About the Author:
Excel Business Resource has partnered with 100+ startups across sports, hospitality, and tech verticals, providing FP&A, data analysis, and financial modeling services. Our templates and advisory services help founders translate operational vision into investor-ready financial narratives.
Battery Energy Storage System (BESS) startups are attracting serious investor attention across energy transition, grid stability, and renewable integration. But when investors review a Battery Energy Storage System (BESS) Financial Forecasting Model, they don’t just look at revenue growth or EBITDA. They dig deep into operational, technical, and unit-economics driven KPIs that prove whether the business can scale, survive volatility, and generate predictable cash flows.
At Excel Business Resource, we have worked with 100+ startups across energy, infrastructure, and industrial sectors, building investor-ready financial models, FP&A frameworks, and business plans. From that experience, one thing is clear: BESS investors care about a very specific set of KPIs and most founders track the wrong ones.
This guide breaks down the essential metrics you need in your Financial Model for Battery Energy Storage System (BESS) to secure funding in 2026.
To accurately analyze the cost of starting a BESS business, you must evaluate the true cost of building a Battery Energy Storage System (BESS) and its profitability. This requires detailed research into equipment pricing, capital expenditures (CapEx), and location-specific market rates.
Why KPIs Matter More Than Ever in BESS Startups
BESS isn’t like SaaS. You can’t iterate your way to product-market fit after launch. These projects swallow millions in upfront capital, then face volatile energy markets, degrading hardware, and regulatory shifts for 15-20 years. Your financial projection model isn’t just a spreadsheet it’s the proof that you understand how your asset performs when conditions get ugly.
Investors use KPIs to answer three core questions:
- Is the BESS asset economically viable at the unit level?
- Can cash flows remain stable under different scenarios?
- Does management understand operational and financial risks?
1. Levelized Cost of Storage (LCOS)
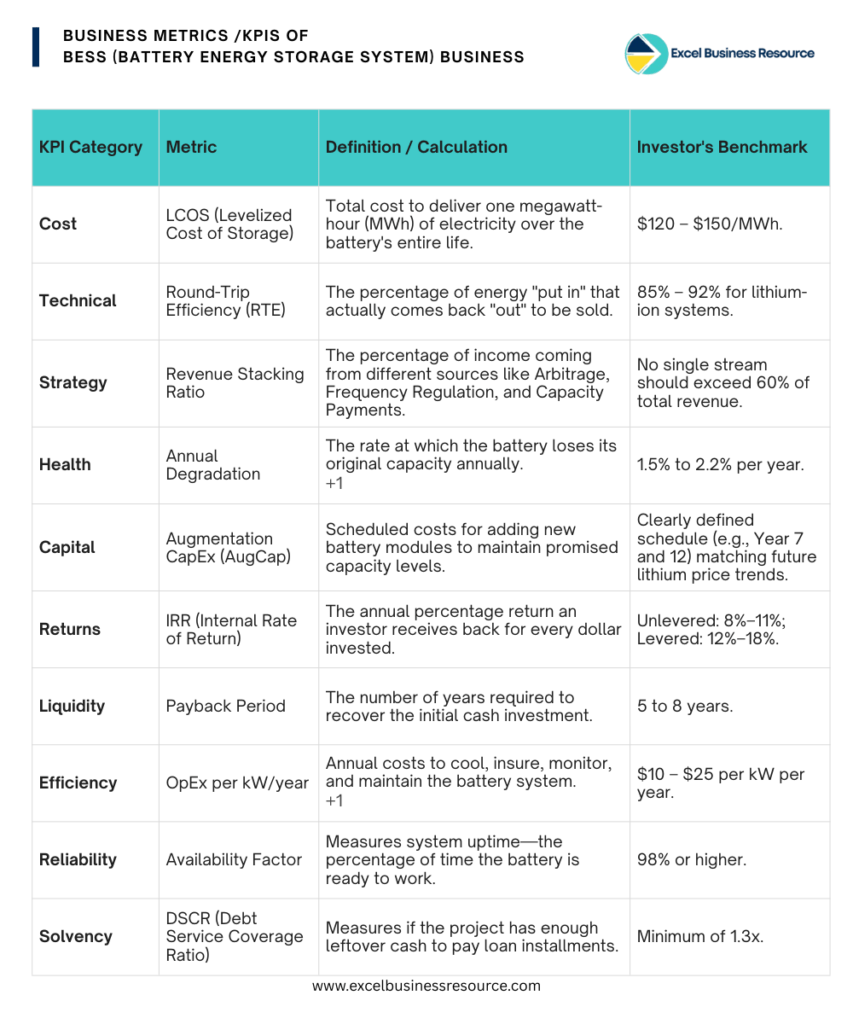
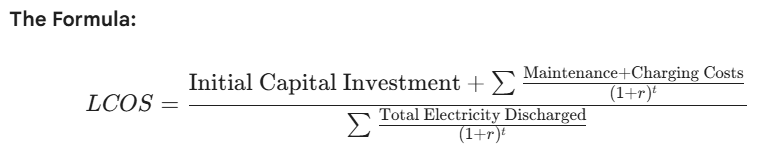
LCOS is essentially the shelf price of your energy. Just as a factory needs to know the total cost to produce one widget, a BESS owner needs to know the total cost to deliver one megawatt-hour (MWh) of electricity over the entire life of the battery.
The Reasoning:
Investors use this to see if your project is competitive. If your LCOS is $150/MWh but the market price for electricity rarely hits $140, your business is fundamentally “out of the money.” It combines construction costs, interest, and the cost of the electricity you bought to “fill” the battery into one single number.
Investor’s Benchmark:
Utility-scale investors are looking for an LCOS between $120 and $150/MWh. If you are higher than this, you’ll need a very strong “Revenue Stacking” story to justify the investment.
2. Round-Trip Efficiency (RTE)
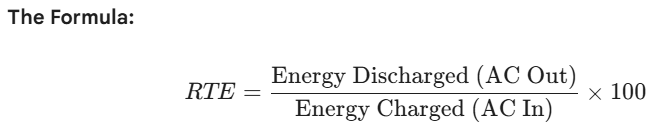
Think of RTE as the leakage metric. Batteries are not 100% efficient; they lose energy as heat when charging and discharging. RTE tells you what percentage of the energy you “put in” actually comes back “out” to be sold.
The Reasoning:
Every percentage point lost in RTE is lost revenue. If you have an RTE of 80%, you are paying for 100 units of power but only getting paid for 80. This directly impacts your Unit Economics. Low RTE usually suggests poor cooling systems or low-quality inverters.
Investor’s Benchmark:
Investors expect 85% to 92% Round Trip Efficiency for lithium-ion systems. Anything below 80% is considered a technical failure in modern BESS Financial Models.
3. Revenue Stacking Ratio
In a BESS Business, you don’t just make money one way. You stack different services. This KPI tracks the percentage of income coming from different sources: Arbitrage (buying low, selling high), Frequency Regulation (helping the grid stay stable), and Capacity Payments (getting paid just to exist).
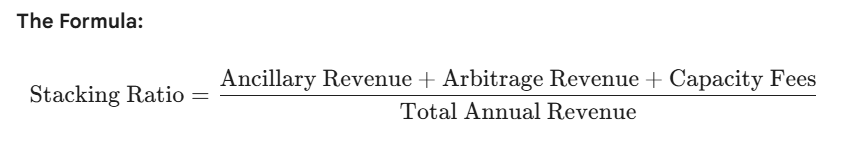
The Reasoning:
Investors hate Single Point of Failure risk. If 90% of your money comes from one government contract that might end, the project is risky. A healthy ratio shows you can pivot. If one market dries up, you can move your battery’s “effort” to another market.
Investor’s Benchmark:
Ideally, no single revenue stream should exceed 60% of the total. Investors love seeing a Baseload of guaranteed capacity payments mixed with “Upside” from market trading.
4. State of Health (SoH) & Annual Degradation
Batteries are like athletes; they get slower and weaker as they age. SoH measures how much of the original juice or capacity the battery still holds compared to when it was brand new.
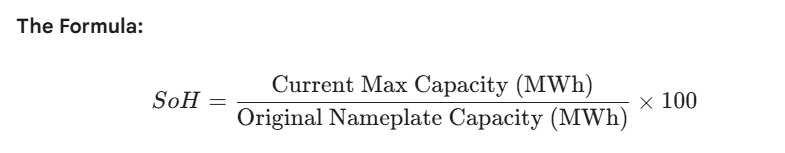
The Reasoning:
This is the core of BESS Business Valuation. If the battery degrades too fast, your asset disappears. If you lose 5% capacity every year, by year 10, you only have half a battery left to sell power from. This is why financial modeling and scenario simulation are vital, you must predict this decay accurately.
Investor’s Benchmark:
A healthy system should have an annual degradation of 5% to 2.2%. If your model shows 1%, investors will think you are being too optimistic; if it’s 4%, they’ll think your technology is poor.
5. Augmentation Capital Expenditure (AugCap)
Because of the degradation mentioned above, you eventually have to top up the system by adding new battery modules to keep the capacity at the promised level. This is called Augmentation.
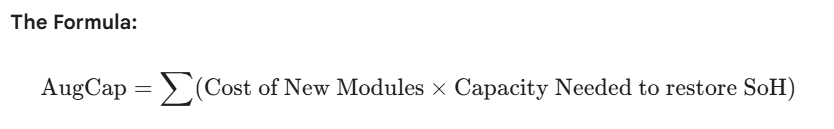
The Reasoning:
This is a massive hidden cost. Many founders forget to put this in their BESS Financial Model. Investors want to see that you have a Sinking Fund or a cash reserve ready for Year 7 or Year 10 when you need to spend millions to refresh the battery cells.
Investor’s Benchmark:
Investors look for a clearly defined schedule (e.g., Year 7 and Year 12) with a cost-per-kWh assumption that matches future lithium price trends.
6. Internal Rate of Return (IRR) - Levered & Unlevered
IRR is the ultimate profitability percentage. It tells an investor: “For every dollar I give you, what is the annual percentage return I get back?”
The Reasoning:
Unlevered IRR tells the investor if the project is good. Levered IRR tells the investor if the deal is good (after accounting for bank loans). If interest rates is high, investors pay attention on the spread the difference between the cost of the loan and the profit of the battery.
Investor’s Benchmark: Unlevered IRR: 8% – 11%
Levered IRR: 12% – 18% (This is where the sweet spot for private equity lies).
7. Payback Period (Breakeven Point)
This is a simple question: “How many years until I get my initial cash back?”
The Reasoning:
Energy technology moves fast. If your project takes 15 years to pay back, a new technology (like Solid State batteries) might make your project obsolete before you’ve even broken even. A shorter payback period reduces “Technology Risk.”
Investor’s Benchmark:
Investors in the BESS space are currently targeting a 5 to 8-year payback period. Anything over 10 years is usually a “no-go” for venture-backed startups.
8. Operating Expenditure (OpEx) per kW/year
Building the battery is just the start. You have to cool it, insure it, pay for the land, and monitor the software. This is your OpEx.
The Reasoning:
High OpEx is a silent killer of Unit Economics. If you have a high-maintenance system that requires constant cooling in a hot climate, your fans will eat all your profit. Investors compare your OpEx against industry standards to see if your team is “lean.”
Investor’s Benchmark:
The target is usually $10–$25 per kW per year. If your costs are $40+, investors will question your operational efficiency.
9. Availability Factor
This measures the Uptime. Is the battery actually ready to work, or is it offline for repairs or software updates?
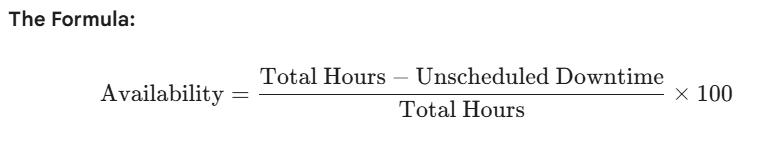
The Reasoning:
In the energy market, 90% of your profit might happen in just 10 hours of the year (during extreme heatwaves or storms). If your battery is “offline” during those 10 hours, your entire year is ruined.
Investor’s Benchmark
Modern BESS projects demand an availability of 98% or higher.
10. Debt Service Coverage Ratio (DSCR)
This is the most important number for the banks. It measures if you have enough leftover cash to pay your loan installments.
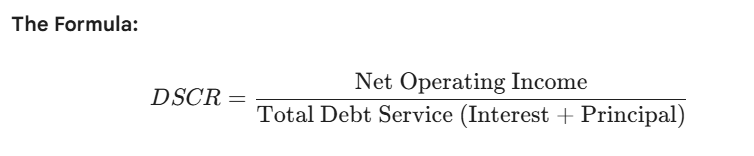
The Reasoning:
If your DSCR is 1.0, you are “living paycheck to paycheck” one bad month and you can’t pay the bank. Banks want a “safety cushion” (the extra 0.3x) to ensure they get paid even if the energy market is quiet.
Investor’s Benchmark:
Banks and project finance investors typically require a Minimum DSCR of 1.3x. If your model shows 1.1x, you won’t get a loan.
Build Authority with Professional Financial Modeling
Investors don’t just invest in batteries; they invest in clarity & discipline, which comes from data analysis and financial modeling and scenario simulation that prove the project’s resilience. At Excel Business Resource, we have helped 100+ startups turn complex technical specs into bankable financial narratives.
How Our BESS Template Helps You Win:
- Unit Economics: Automatically calculates LCOS and RTE based on your hardware specs.
- Scenario Simulation: Stress-test your returns against High Degradation or Market Saturation scenarios.
- Investor Ready: Includes a professional Startup Valuation and a Business Plan Template for BESS
Don’t leave your fundraising to a generic spreadsheet. Download the Battery Energy Storage System (BESS) Financial Model Excel Template and show your investors you speak the language of professional finance.
Founder Ask Questions
Investors primarily focus on unit‑economics and cash‑flow driven KPIs rather than just installed capacity. The most critical ones include Revenue per MW/MWh, Capacity Utilization Rate, Battery Degradation Rate, Cost per MWh Stored, Project IRR, and Cash Flow Coverage Ratio. These KPIs help investors understand whether the BESS project can generate stable, long‑term returns under real‑world operating conditions.
Battery degradation directly impacts long‑term revenue, replacement CapEx, and exit valuation. If degradation is underestimated, the financial model can significantly overstate IRR and equity returns. Investors expect a Battery Energy Storage System (BESS) Financial Model to clearly link charge cycles, efficiency loss, and replacement assumptions, especially over a 10–20 year project life.
A professional Financial Model for Battery Energy Storage System (BESS) translates technical performance into financial outcomes. It allows investors to:
- Test base, upside, and downside scenarios
- Analyze unit economics at dispatch level
- Assess debt service and cash‑flow resilience
- Validate valuation assumptions
This level of data‑driven analysis builds investor confidence and accelerates funding decisions.
In practice, no serious investor reviews a BESS business plan without a robust financial model. A Business Plan Template for BESS explains the strategy, but the financial model proves whether the strategy is viable. Investors expect integrated forecasting, scenario simulation, and KPI‑level transparency—especially for capital‑intensive energy storage projects.
Yes. Excel Business Resource offers customized BESS financial models, FP&A, unit-economics analysis, scenario simulation, and startup valuation. We have worked with 100+ startups, delivering investor-ready and bankable financial models tailored to specific markets and project requirements.