About the EBR:
Excel Business Resource has partnered with 100+ startups across sports, hospitality, and tech verticals, providing FP&A, data analysis, and financial modeling services. Our templates and advisory services help founders translate operational vision into investor-ready financial narratives.
Opening a padel court is easy. Building a padel club that investors actually want to fund is an entirely different game.
After building financial models for 100+ startups across sports tech, hospitality, and leisure infrastructure, one pattern is clear: founders who speak the language of unit economics and capital efficiency raise money faster. Those who focus only on “growing the community” without hard metrics usually burn through their runway before reaching breakeven.
The global padel market is exploding over 7,000 new courts opened in 2024 alone, with the U.S. market projected for “real acceleration” in 2026 and 2027. But growth attracts competition, and competition exposes weak operators. Whether you are pitching angel investors, applying for SBA loans, or running your padel court as a serious business, these ten KPIs form the foundation of every credible financial forecast and business plan for padel court operations.
Before diving into metrics, understand the capital commitment involved. Opening a padel club requires significant upfront investment, typically ranging from $560,000 to $900,000 depending on court count and facility quality. Court construction alone runs $24,000–$65,000 per court, with total CAPEX including renovation, HVAC, and technology reaching substantial sums. Most facilities require 14 months of working capital to reach breakeven, making your choice of which metrics to track not just operational preference but survival strategy.
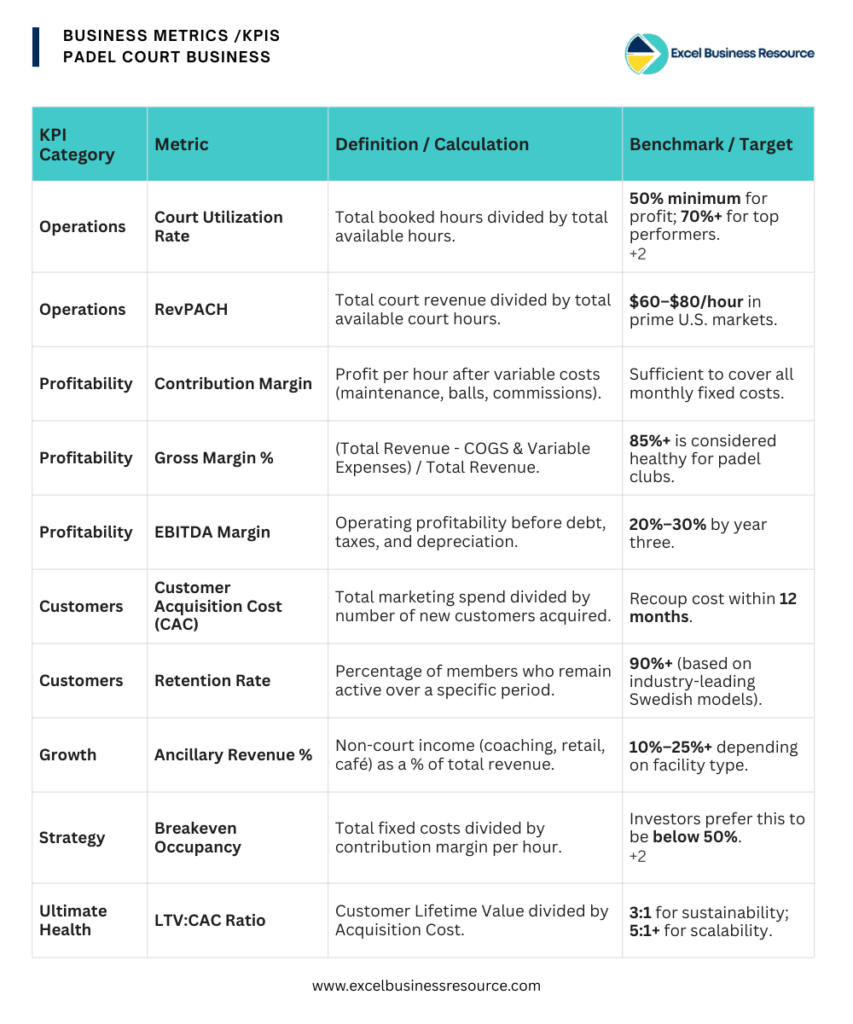
10 Essential Metrics Of Padel Court Business
1. Court Utilization Rate: The Foundation of Everything
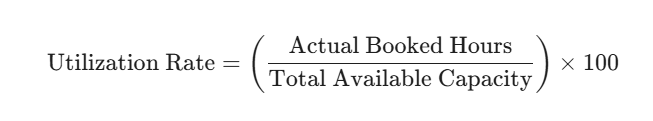
Court Utilization Rate (CUR) measures what percentage of your available court hours actually generate revenue. The math is straightforward: divide total booked hours by total available hours. If you operate 4 courts, 14 hours daily, 30 days monthly, you have 1,680 available hours. Booking 840 hours gives you a 50% utilization rate.
Why investors care:
Courts are fixed assets with fixed costs. Every empty hour is revenue lost forever. Industry benchmarks show that successful clubs hit **50% utilization** minimum for profitability, with top performers reaching 70% or higher. Below 40%, you are likely bleeding cash regardless of your pricing.
Actionable insight:
Track utilization by time block, not just aggregate. Peak hours (5 PM–8 PM weekdays, weekends) should command premium pricing, while mid-morning slots need promotional fills. Dynamic pricing models can increase effective utilization without discounting premium slots.
2. Revenue Per Available Court Hour (RevPACH)
While utilization tracks occupancy, Revenue Per Available Court Hour measures your pricing power. Calculate this by dividing total court revenue by total available court hours (not just booked hours). A club charging $40/hour with 50% utilization has a RevPACH of $20.
Why investors care:
This metric combines operational efficiency with market positioning. European data shows averages around €57,000 revenue per court annually, with U.S. prime markets commanding $60–$80 per hour. Low RevPACH indicates either weak demand or poor pricing strategy both red flags for scalability.
Actionable insight:
Benchmark against local tennis clubs and boutique fitness studios. If your RevPACH lags despite high utilization, you are leaving money on the table through underpricing or over-reliance on discount channels.
3. Customer Acquisition Cost (CAC) by Segment
Not all customers cost the same to acquire. Transactional players who book single sessions through paid ads might cost $50 per acquisition. Members signing annual contracts might cost $150–$300 but generate 10x lifetime value.
Why investors care:
Sustainable unit economics require CAC payback within 12 months. If you are spending $200 to acquire a member who pays $100 monthly, you recover in two months—excellent. If that same member churns before month six, your model breaks.
Actionable insight:
Segment your marketing spend religiously. Track CAC separately for membership drives versus casual court promotions. Target member LTV at least 3x acquisition cost, with member CAC recouped quickly against recurring revenue.
4. Membership Retention Rate: The Predictability Engine
Retention measures loyalty take members at period end, subtract new members, divide by members at period start. Swedish padel clubs demonstrate industry-leading 90%+ annual retention rate through community focus and flexible programming.
Why investors care:
Retention is cheaper than acquisition. A member retained for three years generates predictable cash flow that supports debt service and expansion capital. High churn forces constant expensive marketing, destroying margins.
Actionable insight:
The first 30 days determine retention. Implement structured onboarding: welcome sequences, progress check-ins, and social matching. Clubs using tiered loyalty programs report 15–20% higher retention through visible progression and meaningful perks like priority booking.
5. Ancillary Revenue Percentage: Beyond Court Bookings
This metric tracks non-court income: coaching, pro shop sales, café revenue, events, and sponsorships. Calculate by dividing ancillary revenue by total revenue. Strong targets range from 10–15% for basic clubs to 25%+ for fully integrated lifestyle venues.
Why investors care:
Court hours are capped by physical capacity. Ancillary revenue scales without proportional cost increases coaching sessions use the same courts during off-peak hours, while retail sales require minimal incremental overhead. High ancillary mix indicates diversified, resilient revenue streams.
Actionable insight:
Spanish academy models generate up to 70% of total revenue through coaching and education. Even modest coaching programs can shift your economics from breakeven to highly profitable.
6. Contribution Margin Per Court Hour
This measures profitability per hour after variable costs: court maintenance, commissions, supplies, and direct labor. If you charge $50 per hour but pay $15 in commissions, $5 in ball replacement, and $10 in coaching fees, your contribution margin is $20.
Why investors care:
Fixed costs rent, insurance, base salaries—must be covered by aggregated contribution margins. Knowing your margin per hour tells you exactly how many bookings you need to break even, taking the guesswork out of financial forecasting.
Actionable insight:
Aggressively manage commission structures. Some clubs pay 50% to booking platforms a massive margin killer. Shifting just 20% of bookings to direct channels can improve contribution margin significantly without raising prices.
7. Breakeven Occupancy Rate
Calculate this by dividing total fixed costs by contribution margin per available court hour. If your monthly fixed costs are $30,000 and your average contribution margin is $25 per hour, you need 1,200 booked hours monthly to break even.
Why investors care:
This is the “survival line.” Knowing your breakeven occupancy allows stress-testing scenarios: what happens if winter reduces demand 20%? What if a new competitor opens nearby? Investors want to see breakeven below 50% utilization, giving you margin for error.
Actionable insight:
Design your facility to minimize fixed costs during ramp-up. Negotiate rent abatement periods or revenue-sharing leases. The lower your breakeven point, the faster you reach sustainable cash flow.
8. Gross Margin Percentage: Operational Efficiency
Gross margin equals total revenue minus cost of goods sold and direct variable expenses, divided by total revenue. Healthy padel clubs maintain 85%+ gross margins, reflecting the asset-light nature of the business once courts are built.
Why investors care:
High gross margins indicate pricing power and cost discipline. They provide cushion to absorb marketing expenses, debt service, and unexpected repairs while still generating EBITDA. Margins below 80% suggest either underpricing or runaway variable costs.
Actionable insight:
Audit your supply chain quarterly. Bulk purchasing for balls, nets, and rental equipment reduces COGS. Energy-efficient lighting and HVAC cut utility costs, which often represent significant variable expenses.
9. EBITDA Margin and Growth Trajectory
EBITDA margin tracks operating profitability before debt, taxes, and depreciation. Quality padel operations target 20%+ margins by year three, with top performers reaching 30% or higher. Year 2 EBITDA of $66,000 growing to $642,000 by year five represents the scalability investors seek.
Why investors care:
EBITDA determines debt service capacity and valuation multiples. A club generating $250,000 annual EBITDA might secure 4–5x valuation in an acquisition $1M–$1.25M exit value. Low or negative EBITDA indicates you own a job, not a business.
Actionable insight:
Drive EBITDA through volume scaling, not just price increases. Doubling court bookings while holding fixed costs flat dramatically improves margins. Coaching programs and corporate events provide high-margin revenue that flows directly to bottom line.
10. Lifetime Value to CAC Ratio (LTV:CAC)
The ultimate health metric: divide projected lifetime value of a customer segment by acquisition cost. For members paying $150 monthly with 24-month average retention, LTV equals $3,600. Against $300 CAC, your ratio is 12:1 exceptional.
Why investors care:
This single ratio validates your entire business model. Ratios below 3:1 suggest unsustainable economics regardless of top-line growth. Ratios above 5:1 indicate scalable, profitable customer acquisition worthy of expansion capital.
Actionable insight:
Increase LTV through membership upgrades, tournament participation, and retail purchases. Decrease CAC through referral programs padel is inherently social, and member referrals often convert at half the cost of paid channels.

Building Your Financial Forecasting Model Template
Tracking these metrics requires robust financial systems. Spreadsheets work for single locations but break down when scaling to multiple clubs or seeking institutional investment. A comprehensive financial model template for padel court businesses automates these calculations, scenarios, and investor reporting.
The difference between padel clubs that raise capital and those that stagnate often comes down to data presentation. Investors want to see five-year projections with sensitivity analysis: what happens if utilization is 10% lower? What if construction costs overrun by 15% Professional financial forecasting models for padel court operations answer these questions before they are asked.
Ready to build investor-ready financial projections for your padel club?
Check out our Padel Club Financial Model Excel Template designed specifically for startup founders seeking funding, featuring automated KPI dashboards, scenario analysis, and valuation models tested with 100+ startups. For a comprehensive guide on structuring your business strategy, read our detailed post on How to Write a Business Plan for a Padel Club.
Founder Ask Questions
The real number ranges from $560,000 to $900,000 for a multi-court facility, though single-court setups can launch closer to $130,000–$180,000. Court construction typically runs $24,000–$65,000 per court depending on surface materials (concrete vs. turf) and infrastructure quality. The bigger expenses often hide in renovation, HVAC, seating, lighting, and technology—pro booking systems and member management platforms add another $10,000–$30,000. Most critically, you need 14 months of working capital to survive until breakeven. We break down every cost category in our detailed guide on startup costs for padel court businesses, including hidden permitting delays and seasonal cash flow gaps that kill undercapitalized ventures.
Investors expect a 5-year three-statement model with integrated cash flow, P&L, and balance sheet projections specifically built for padel unit economics. Generic startup templates miss critical nuances: court utilization curves by season, tiered membership pricing optimization, and ancillary revenue streams like coaching and events. Your model must demonstrate breakeven analysis per court, sensitivity to 20% demand swings, and clear path to 20%+ EBITDA margins. The Padel Club Financial Model we built includes investor-ready dashboards tracking all 10 KPIs covered in this article, with automated valuation multiples and cap table modeling for Series A readiness.
Most padel clubs reach operational breakeven between 12–18 months, assuming 50%+ court utilization and disciplined cost control. However, cash flow positivity often lags 3–6 months behind accounting breakeven due to receivables from corporate accounts and membership prepayments. The critical factor is your ramp-up velocity—clubs that launch with pre-sold memberships and corporate partnerships hit profitability 40% faster than those relying on walk-in traffic. Your financial forecasting model should stress-test scenarios: what if winter cuts utilization 30%? What if a competitor opens within 5 miles? Professional FP&A analysis identifies these breakpoints before they become crises.
Three fatal patterns: First, founders underestimate fixed cost burden rent and loan payments continue whether courts sit empty or full. Second, underpricing to build community destroys unit economics; $30/hour might fill courts but won't cover debt service on $600K buildouts. Third, ignoring ancillary revenue clubs dependent solely on court bookings cap growth at physical capacity. The clubs thriving at 30%+ EBITDA margins treat coaching, retail, and events as core revenue pillars, not afterthoughts. Our work with 100+ startups shows that founders who model these scenarios in advance and adjust strategy before month six—are the ones scaling to multi-location portfolios.
Absolutely, this is where most founders need us. We specialize in retroactive financial restructuring: cleaning up messy historical books, building credible projections from sparse data, and creating investor materials that tell your growth story compellingly. Whether you need a quick valuation for friends-and-family round, detailed due diligence package for institutional investors, or operational KPI dashboards to optimize before scaling, our FP&A team bridges the gap between where you are and funding readiness. Book a consultation to review your current numbers we often identify 15–20% efficiency gains in pricing or cost structure that immediately improve valuation multiples.