Building a B2C SaaS startup feels like chasing a moving target. You have thousands of individual users, each making their own decisions about whether to stay or leave. Unlike enterprise software where you negotiate six-figure contracts with procurement teams, consumer SaaS lives and dies by unit economics at scale. Understanding exactly how money flows through your business model isn’t just helpful, it’s the difference between sustainable growth and burning cash on a leaky bucket.
At Excel Business Resource, we’ve built financial models for over 100 startups navigating this exact challenge. We’ve seen what separates the breakout successes from the companies that stall out at $50K MRR. This guide breaks down the real mechanics of B2C SaaS revenue generation, the metrics that actually matter, and how to build a financial foundation that supports long-term growth.
The Anatomy of B2C SaaS Revenue Streams
Most founders think revenue is just “subscriptions times price.” That oversimplification kills companies. In reality, B2C SaaS revenue comes from multiple interconnected streams, each with different margins and growth potential.
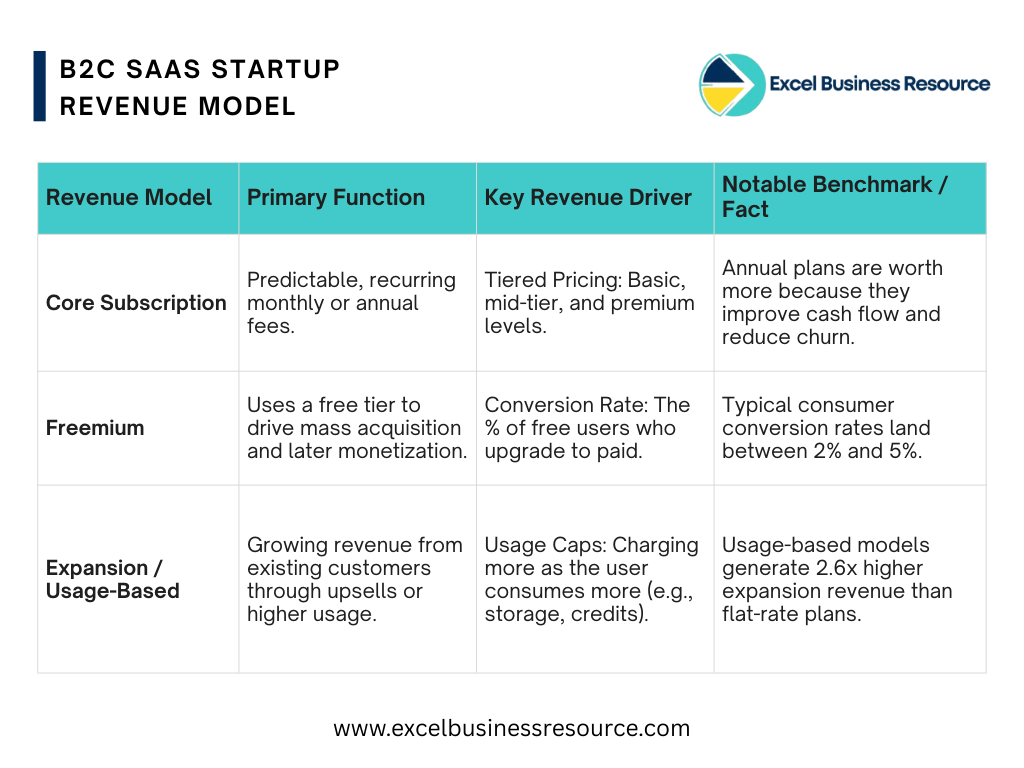
Core Subscription Revenue: Your Predictable Foundation
The primary engine of any B2C SaaS is recurring subscription fees. This is the money users pay monthly or annually for access to your product. According to industry data, this predictable revenue stream forms the basis of your Annual Recurring Revenue (ARR) and drives company valuation.
But here’s where it gets interesting: not all subscription revenue is created equal. Annual plans are worth significantly more than monthly ones because they reduce churn and improve cash flow. When customers pay upfront for a year, you get immediate capital to reinvest in growth while locking in commitment that prevents casual cancellations.
The key is structuring your tiers correctly. Successful B2C SaaS companies typically offer three pricing levels: a basic tier for casual users, a mid-tier for regular customers, and a premium tier for power users. This captures different willingness-to-pay levels without alienating budget-conscious customers.
The Freemium Engine: Acquisition vs. Monetization
Freemium has become the dominant model for consumer SaaS, but it requires careful balancing. Research shows that freemium conversion rates typically land between 2% and 5% for B2B SaaS, though consumer-facing products sometimes see higher rates depending on the value proposition.
The strategy works when your free tier delivers genuine value while creating natural upgrade triggers. For example, storage limits, advanced features, or usage caps should kick in right when users feel invested in your product. Feature restrictions typically work better than time limits for B2C audiences because they reduce pressure while maintaining engagement.
However, freemium isn’t free for you. Supporting thousands of non-paying users incurs real costs in server infrastructure, customer support, and engineering resources. Your financial model needs to account for these unit costs and ensure that the lifetime value of converted users significantly exceeds the blended acquisition cost across both free and paid tiers.
Expansion Revenue: The Growth Multiplier
Smart B2C SaaS companies don’t just acquire new customers—they grow existing ones. Expansion revenue comes from users upgrading to higher tiers, purchasing add-ons, or increasing usage beyond their current plan limits.
This is where usage-based pricing shines. Recent data shows that usage-based pricing models reduce churn by 46% compared to flat-rate models and generate 2.6 times higher expansion revenue through natural usage growth
. When customers pay only for what they consume, they perceive greater pricing fairness and feel less pressure to churn.
For consumer products, expansion might look like a photo editing app user upgrading to pro features, a fitness app subscriber adding nutrition coaching, or a productivity tool user adding team members. Each of these micro-transactions compounds over time, turning a $10/month customer into a $30/month customer without any new acquisition cost.
The Metrics That Determine Your Fate
Above sections gives you an understanding of revenue model of SaaS business, but subscription & freemium model will be useless unless founder doesn’t focus on the unit economics, which is actually a revenue drivers for SaaS & its profitability.
Customer Acquisition Cost (CAC): The Price of Growth
CAC represents every dollar you spend to acquire one new paying customer. This includes paid advertising, content marketing, sales team salaries, and any onboarding costs. According to recent benchmarks, average CAC for SaaS businesses has jumped by more than 55% over the past five years.
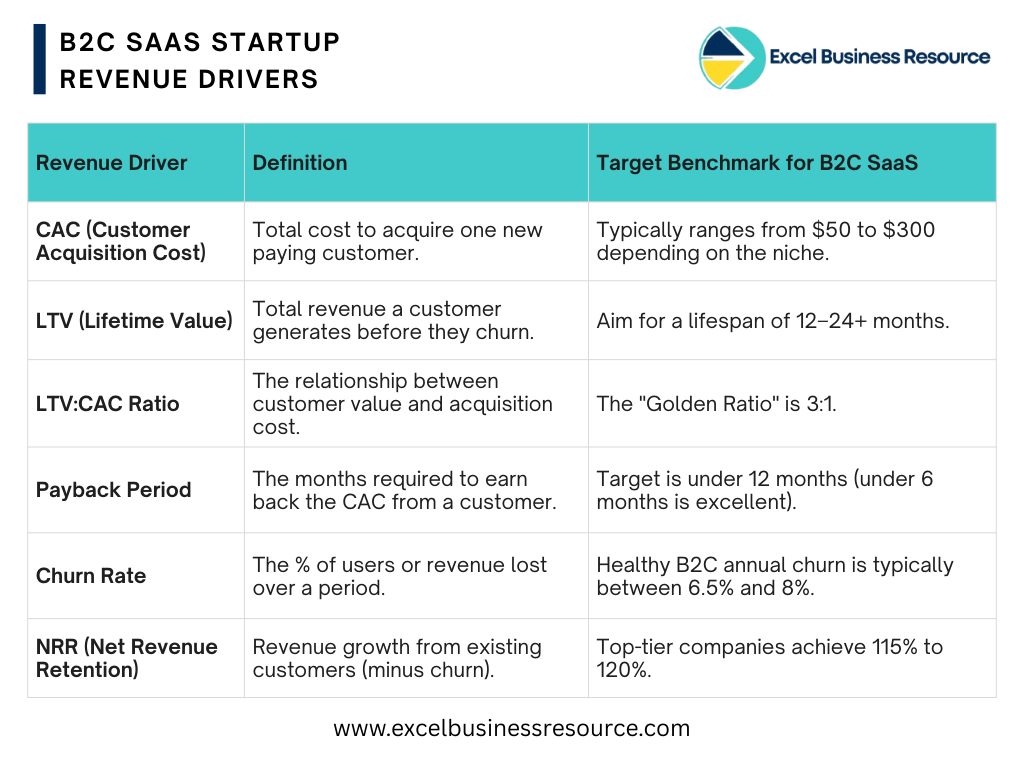
For B2C SaaS, CAC typically ranges from $50 to $300 depending on your vertical and channel mix. The danger zone is when CAC approaches or exceeds your average revenue per user (ARPU). If you’re spending $100 to acquire a customer who pays $10/month, you need that customer to stay for at least 10 months just to break even and that doesn’t account for the cost of serving them.
The most efficient B2C SaaS companies optimize CAC by doubling down on organic channels and viral loops. While paid acquisition provides predictable growth, organic traffic through SEO, referrals, and product-led growth typically delivers better unit economics over time.
Customer Lifetime Value (LTV): The Long Game
Customer lifetime value CLTV estimates the total revenue a customer generates before churning. The formula is straightforward: multiply your average revenue per user by gross margin, then divide by your churn rate. But the implications are profound.
Benchmark data shows that B2C SaaS companies typically see customer lifespans of around 12 months, with 24+ months considered strong performance. This means your churn rate is often the biggest lever on LTV. A 5% monthly churn rate gives you a 20-month average customer lifetime, while a 10% monthly churn cuts that to just 10 months halving your LTV without changing anything else.
Recent research indicates that B2C SaaS faces annual churn rates between 6.5% and 8%, significantly higher than B2B SaaS at 3.5%. This reality means B2C founders must be obsessive about retention mechanics from day one.
The Golden Ratio: LTV to CAC
The relationship between lifetime value and acquisition cost determines whether your business model works. The standard benchmark across SaaS is a 3:1 ratio you should generate at least three times your acquisition cost from each customer.
This ratio isn’t arbitrary. It accounts for the cost of serving customers, the risk of churn, and the capital required to fund growth. A ratio below 3:1 suggests you’re spending too much to acquire customers relative to their value. Above 5:1 might indicate you’re underinvesting in growth and missing market opportunities.
Improving this ratio comes from either increasing LTV (through better retention or higher pricing) or decreasing CAC (through more efficient channels). Most successful B2C SaaS companies focus on retention first because it’s more cost-effective to keep existing customers than acquire new ones.
CAC Payback Period: Cash Flow Reality
Even with strong LTV:CAC ratios, you can go broke if you don’t recover acquisition costs quickly enough. The CAC payback period measures how many months it takes to earn back your acquisition spend from a customer’s gross margin.
Industry benchmarks suggest targeting a payback period under 12 months, with under 6 months being excellent. Longer payback periods strain cash reserves and limit how fast you can scale. If you’re paying $150 to acquire customers who generate $15/month in gross profit, you need 10 months to break even. During those 10 months, you’re funding growth out of pocket or burning venture capital.
This is why annual upfront payments are so valuable. When a customer pays for a year in advance, you recover your CAC immediately and fund the next round of acquisition without waiting months for payback.
Churn: The Silent Killer of B2C SaaS
Churn is the percentage of customers or revenue you lose each period. For B2C SaaS, this is often the metric that separates thriving companies from struggling ones.
Understanding Voluntary vs. Involuntary Churn
Voluntary churn happens when customers actively decide to cancel. This usually indicates product-market fit issues, pricing misalignment, or competitive pressure. According to 2025 data, voluntary churn for B2B SaaS ranges from 2.6% to 3.3% monthly, but B2C products typically see higher rates due to lower switching costs and shorter commitment periods.
Involuntary churn occurs when customers want to stay but can’t due to payment failures. This is particularly brutal for B2C SaaS because individual consumers are more likely to use debit cards or prepaid cards with insufficient funds. Research shows B2C businesses face 9% involuntary churn rates compared to 6% for B2B, with prepaid card users experiencing 23% involuntary churn.
The good news is that involuntary churn is fixable. Implementing smart retry logic, automated card updaters, and dunning workflows can recover significant revenue. Stripe data shows that a recovered subscription continues for an average of seven additional months, meaning each saved payment protects nearly a year of future revenue .
Churn Benchmarks by Model
Your pricing model significantly impacts churn rates. Recent 2025 data reveals dramatic differences:
- Usage-based pricing: 2.1% monthly churn (22.9% annual)
- Hybrid models: 2.8% monthly churn (29.4% annual)
- Per-seat pricing: 3.9% monthly churn (39.1% annual)
- Single flat-rate: 5.6% monthly churn (52.1% annual)
This 46% reduction in churn for usage-based models fundamentally changes your unit economics. Lower churn means higher LTV, which means you can afford higher CAC, which means faster growth.
Valuation: How Investors Actually Value B2C SaaS
When it comes time to raise funding or sell your company, valuation isn’t based on hope, it’s based on metrics. For SaaS companies, the ARR Multiple Method is the gold standard: Valuation equals Annual Recurring Revenue multiplied by a growth-adjusted multiple.
What Drives Your Valuation Multiple
The multiple isn’t arbitrary. It’s determined by three critical factors:
Growth Rate:
Companies growing 100%+ year-over-year command 10x to 15x multiples, while mature companies growing under 20% might see 3x to 5x.
Net Revenue Retention (NRR):
This measures whether existing customers are expanding or contracting. An NRR over 100% means you’re growing even without new customers—a powerful signal to investors. Top-tier B2C SaaS companies achieve 115% to 120% NRR through expansion revenue.
Gross Margin:
Software should have high gross margins—typically 75% or more. This indicates an efficient, scalable business where additional revenue doesn’t require proportional cost increases.
The Rule of 40
Modern investors look for the “Rule of 40”: your growth rate plus profit margin should exceed 40%. A company growing 50% annually with -5% profit margins hits the rule (50 + (-5) = 45). So does a company growing 20% with 25% margins (20 + 25 = 45).
This framework balances growth and profitability. Pure growth at all costs has fallen out of favor investors now want to see a clear path to sustainable unit economics.
Building Your Financial Model For SaaS Startups
Understanding these concepts is useless without a financial model that brings them together. A proper B2C SaaS financial model template in Excel should include:
Input Assumptions:
Pricing tiers, churn rates, CAC by channel, growth rates, and conversion rates from free to paid.
Revenue Forecasts:
Monthly breakdowns of new subscribers, upgrades, downgrades, and churn impact on MRR and ARR.
Unit Economics Dashboard:
Automatic calculation of CAC, LTV, payback period, and LTV:CAC ratios with visual indicators when metrics fall below benchmarks.
Cash Flow Analysis:
Operating, investing, and financing cash flows with runway calculations and break-even analysis.
Valuation Scenarios:
DCF valuation and exit multiple methods based on different growth and profitability assumptions.
The model should be dynamic, allowing you to test scenarios like “What if we reduce churn by 20%?” or “How does annual billing upfront impact our runway?” These what-if analysis are crucial for strategic decision-making and investor conversations.
Struggling to build a financial model that actually fits your business?
Click here for a complete guide on building a custom financial model tailored to your needs.
Putting It All Together
B2C SaaS success comes down to mastering the relationship between acquisition, monetization, and retention. You need to acquire customers efficiently, monetize them effectively through the right pricing model, and retain them long enough to generate profit.
The companies that win are those that treat financial modeling as a strategic tool, not just a fundraising requirement. They understand their unit economics by heart, test pricing changes methodically, and optimize for long-term value over short-term vanity metrics.
If you’re building a B2C SaaS startup, start with a solid financial foundation. Build a model that tracks the metrics we’ve discussed, validate your assumptions with real data as you grow, and adjust your strategy based on what the numbers tell you. The market is crowded, but the fundamentals of good business haven’t changed deliver value, price fairly, and keep your customers happy.
About the Author: Excel Business Resource has partnered with 100+ startups on financial modeling, FP&A, and business planning. We specialize in helping B2C SaaS founders build investor-ready financial models that tell compelling stories with solid numbers. Whether you need a SaaS Excel model template or custom financial forecasting, we provide the tools and expertise to help you scale with confidence.