
Most of the time, when i review revenue forecasting model of coworking space business are fundamentally broken. They use flat occupancy assumptions, ignore membership churn, and lump five distinct revenue streams into a single ‘Revenue’ line. The result? A model that looks clean on Day 1 and becomes dangerously misleading by Year 2.
In this guide, I will walk you through the professional standard for building a coworking revenue forecast in Excel, the same methodology embedded in our Coworking Space Financial Model Template. Whether you are an operator preparing for your first location or an investor evaluating a portfolio acquisition, these principles are non-negotiable.
The Core Philosophy: Coworking Is a Yield Management Business
The single most important mindset shift for any coworking operator or investor is this: you are not running a simple rental business. You are running a yield management operation exactly like a hotel or an airline.
💡The Core Principle of Yield Management
- Your inventory (desks, offices, square footage) is fixed and perishable.
- Every empty desk tonight is revenue you can never recover.
- Your mission: maximize Revenue Per Occupied Unit (RevPOU) across every single day.
A good coworking space financial plan will clear out questions arise in mind i.e. “Can coworking space be profitable?”. This is why a generic Excel template with a single Monthly Revenue cell is professionally irresponsible. Your model must reflect the economic reality. Different inventory types command different prices, fill at different rates, and churn at different speeds.
The Concept of Inventory Segmentation
Before you type a single formula, you must segment your physical inventory. In a professional model, we treat each membership tier as a separate business unit with its own economics:
- Hot Desks: Highest volume, lowest price per unit, highest churn. These are your ‘airline economy seats.’
- Dedicated Desks: Mid-tier. Better retention than hot desks, predictable MoM revenue.
- Private Offices: Premium inventory. Highest RevPOU, longest commitment cycles (typically 3-12 months), and the slowest ramp-up curve.
The industry benchmark for a mature coworking operation is 80% blended occupancy across your primary inventory. But here is what most operators miss: you will not get there for 12-18 months, and the path to 80% is not linear. Before you think about revenue, you need to understand your full cost structure. I recommend reviewing the detailed breakdown of coworking space startup costs to calibrate your assumptions properly.
The Sacred Input Drivers Sheet: Your Model's Single Source of Truth
Every professional financial model has one cardinal rule: all assumptions live in exactly one place. I call it the Sacred Input Sheet and in our Coworking Model, it is the Input Drivers tab.
Why yellow/ Grey colored Input Cells Are Non-Negotiable
In a production-grade model, input cells must be visually distinct from formula cells. The professional convention is to use grey or cream-shaded cells for every user-editable assumption. This is not aesthetic preference it is a structural safeguard, because it is easy to find all changeable cells at one place, you don’t need to find a driver’s cell throughout in the startup financial model template.
💡The Three-Layer Protection Rule
- Layer 1 — Visual: Grey/cream cells signal this is where you type.
- Layer 2 — Audit: When a colleague or investor audits your model, they immediately know which cells drive the outputs.
- Layer 3 — Protection: Lock all formula cells. Only the input cells should be editable. A single accidental keystroke in a formula cell can corrupt an entire 5-year projection silently.
Look at the Input Drivers sheet from our professional coworking space financial projection model below. You will notice how the space capacity, price per month, number of shifts, ramp-up percentages, and all key assumptions are cleanly separated in editable cells:
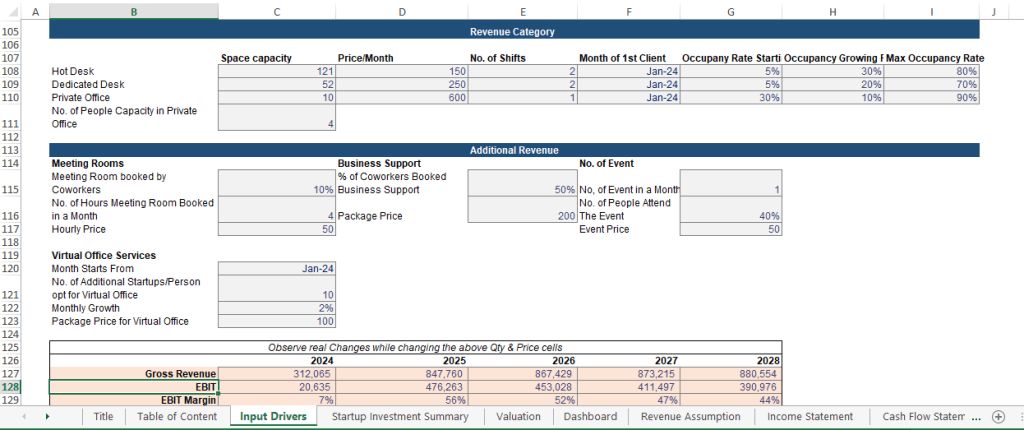
Dynamic Inventory Mechanism: Every Assumption Must Be a Driver
- A static model says: Revenue = 50 desks × $300.
- A dynamic model says: Revenue = Units × Price × Occupancy Rate × Shift Factor × (1 – Churn Rate).
Static forecasting, where a model’s parameters or assumptions remain fixed despite changing real-world conditions, is considered catastrophic in volatile, modern environments. It fails to account for shifts in market demand, consumer behavior, or supply chain shocks, resulting in models that are rapidly outdated and inaccurate.
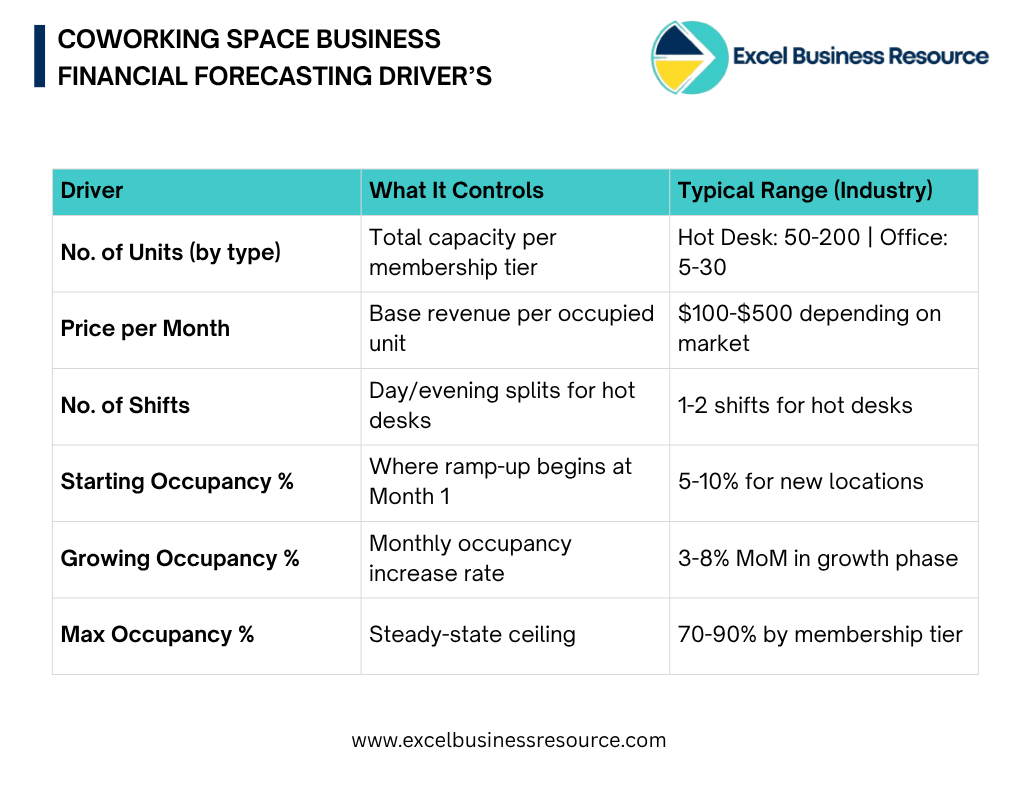
In a professionally built model, every number you see in the output is the downstream result of a driver on your Input sheet. Here are the core inventory drivers you must include in the coworking space budgeting model:
Part 3: The Most Misunderstood Element in Coworking Models
I have reviewed dozens of coworking financial models submitted to investors. The single most common error is the one that instantly signals an amateur model. Assuming 100% (or even 50%) occupancy from Day 1. It never happens. Not once. Not in any market in the world.
Why You Cannot Forecast 100% Occupancy from Day 1:
Think about the operational reality your space opens, you have zero members, and you must acquire them one by one. Word-of-mouth takes months to build. Corporate clients require 60-90 day sales cycles. Even a well-marketed new location in a prime market typically sees:
- Month 1-3: 5-15% occupancy (early adopters, founding members)
- Month 4-8: 15-40% occupancy (word-of-mouth growth, initial marketing ROI)
- Month 9-18: 40-70% occupancy (operational maturity, community effects)
- Month 18+: 70-85% steady state (mature operations, waiting lists possible)
Critically, private offices ramp up slower than hot desks but churn less once filled. Hot desks ramp up faster but require constant member acquisition to maintain occupancy. These dynamics must be modeled separately.
Building the Monthly Lease-Up Curve in Excel:
The professional approach is to build a dynamic occupancy curve using three parameters per inventory type: Starting Occupancy %, Growing Occupancy % (monthly step-up), and Maximum Occupancy %. The formula logic looks like this:
💡Monthly Occupancy Rate for each desk type:=MIN(Max Occupancy, Start Occupancy + (Month Number – 1) * Monthly Growth Rate)
Then: Monthly Revenue = Units × Price × Shifts × Occupancy Rate
Private Office Example (Month 6):
=MIN(90%, 30% + (6-1) * 10%) = MIN(90%, 80%) = 80% occupancy
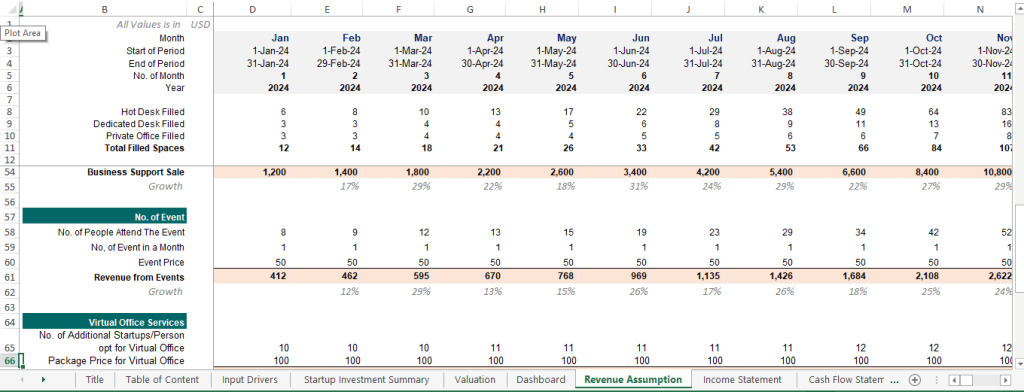
Looking at the Revenue Assumption sheet from the model below, you can see how this translates into actual monthly filled spaces across all three desk types each growing at its own pace:
The Churn Factor: Modeling Net Growth, Not Gross Growth
Here is the component that separates a $500 template from a $5,000 professional model: membership churn. Gross occupancy growth means nothing if you are losing 15% of your members every month.
In a dynamic model, churn is modeled as a monthly rate applied to your existing member base:
💡Net New Members = Existing Members – (Gross New Sign-ups – Monthly User Churn)For Hot Desks (higher churn), a 8-12% monthly churn rate is realistic.
For Private Offices (lower churn), 3-5% monthly churn is more appropriate.
Without modeling churn, your Month 24 occupancy will be wildly overstated. I cover how to optimize member retention strategies (which directly reduce churn) in detail in this guide on how to increase profitability of coworking space.
Part 4: Tiered Revenue Streams
A mature coworking space businesses rarely generates more than 60% of its revenue from desk rentals alone. The remaining 40% comes from ancillary services and modeling this correctly is where significant upside is hidden.
The Six Revenue Streams in a Coworking Model:
1. Hot Desk Revenue
The highest-volume, most volatile stream. Forecast using: Units × Price × Shifts × Dynamic Occupancy Rate. Apply the highest churn factor here (8-12% monthly for flexible memberships).
2. Dedicated Desk Revenue
More stable than hot desks. Members commit to a specific desk, reducing daily variance. Model with a lower churn rate (5-8% monthly) and a slightly higher starting occupancy (members who want dedicated desks are more committed).
3. Private Office Revenue
Your premium inventory. Slowest ramp-up but the highest RevPOU and the lowest churn (3-5% monthly). In our model, private offices drive the largest single revenue line by Year 2 despite having the fewest units because the price premium is significant.
4. Meeting Room Revenue — The Ancillary Multiplier Method
Here is where professional modelers apply a technique I call the Ancillary Multiplier: instead of guessing a flat meeting room revenue number, you tie it to your active member count.
💡The Ancillary Multiplier Formula for Meeting Rooms
% of Members Who Book a Meeting Room = Input Driver (e.g., 10%)
Avg. Hours Booked per Month = Input Driver (e.g., 4 hours)
Hourly Rate = Input Driver (e.g., $50/hour)
Meeting Room Revenue = Active Members × 10% × 4 hrs × $50
Why this works: As your member base scales, meeting room revenue scales automatically.
No manual updates needed it is fully dynamic.
5. Business Support Services
Printing, admin support, mail handling packages. Model as a percentage of total active members who purchase a business support package. In our model, this defaults to 50% of coworkers buying a business support package at a defined price a realistic conversion rate for mid-tier coworking spaces.
6. Virtual Office Services
A growing and underappreciated revenue stream. Many startups and remote workers need a professional address and mail handling without a physical desk. Model this using: Initial Virtual Members + Monthly Growth Rate. Since churn is low (virtual members are sticky), this compounds nicely over 5 years.
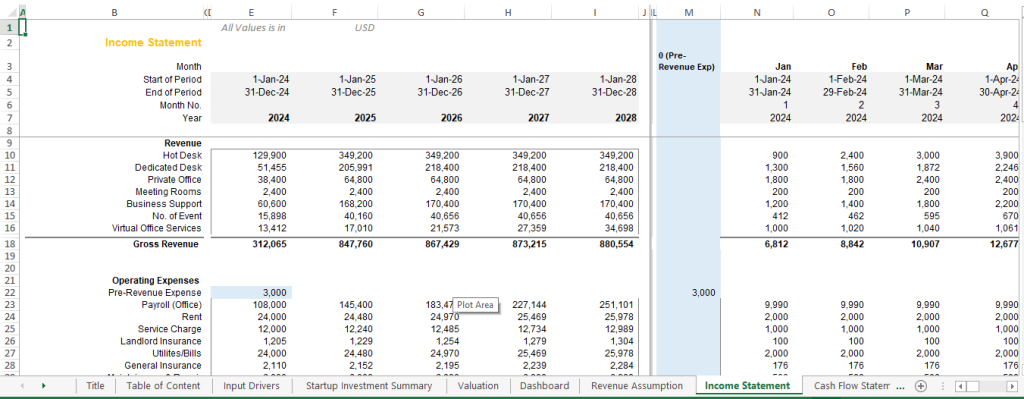
You can see all six revenue streams modeled in our Income Statement output, which feeds directly from the Revenue Assumption drivers:
For a complete framework on which KPIs to track against these revenue lines — including RevPOU, Member Lifetime Value, and Cost Per Acquisition; see Coworking Space KPIs for Measuring Success.
Part 5: Revenue Per Square Foot and RevPOU — The Metrics That Matter to Investors
If you are building a model for investor presentation or bank financing, you need to go one layer deeper than gross revenue. Sophisticated investors evaluate coworking businesses on two space-efficiency metrics:
Revenue Per Square Foot (RevPSF)
This tells an investor how efficiently you are monetizing your physical footprint. A typical well-run coworking space targets $25-$65 per square foot annually, compared to $15-$30 for traditional office space — justifying the premium rent you pay.
💡 RevPSF (Annual) = Annual Gross Revenue / Total Leasable Square FootageExample: $867,429 Revenue / 10,000 sq ft = $86.74/sq ft
This signals strong yield performance to a commercial real estate investor
Revenue per Occupied Unit (RevPOU)
This is the coworking equivalent of a hotel’s RevPAR (Revenue per Available Room). It tells you how much revenue each filled desk is generating combining your pricing power with your ancillary attach rates.
💡RevPOU = Total Monthly Revenue / Total Occupied UnitsTarget: RevPOU should increase over time as ancillary revenue grows
Even if desk prices remain flat — this demonstrates operational maturity
These metrics require your model to be structured with physical inventory clearly defined in the Input Drivers — which is exactly why Inventory Segmentation (Part 1) is the foundation. If you are also thinking about how to write a winning coworking business plan that includes these metrics, these model outputs feed directly into your plan’s financial chapter.
Part 6: From Revenue Forecast to Valuation
A revenue forecast in isolation is not a financial model. A complete professional model connects your revenue assumptions to the full financial picture through a structured waterfall:
01 | Revenue Forecast | All six streams, monthly, 5-year horizon with ramp-up and churn |
02 | Operating Expenses | Payroll, rent, utilities, insurance modeled as fixed + variable components |
03 | EBITDA & EBIT | Operating profitability at each margin level |
04 | Capital Expenditures | Fit-out costs, equipment depreciation tied to Startup Investment Summary |
05 | Cash Flow Statement | Operating, investing, financing cash flows monthly and annual |
06 | Balance Sheet | 5-year projected balance sheet for debt financing presentations |
07 | Terminal value + NPV of cash flows to derive enterprise value | |
08 | Investor Dashboard | KPI summary, charts, occupancy heat maps, the ‘one-pager’ for stakeholders |
The DCF Valuation step deserves special mention. Once you have a clean, driver-based revenue model, you can run a proper Discounted Cash Flow valuation to understand the true enterprise value of your coworking business or to evaluate an acquisition at the right multiple.
The Reality: Why This Takes 100+ Hours to Build Correctly
I want to be transparent about what it actually takes to build a model at this level of rigor. Building a professional coworking financial model from scratch with proper inventory segmentation, dynamic ramp-up curves, churn modeling, six revenue streams, monthly-to-annual aggregation, and investor-ready dashboards is a 100+ hour development project.
And the stakes are real. A single broken circular reference in a multi-location coworking model say, a churn formula that feeds back into the occupancy assumption can overstate your Year 5 revenue by 30-40%. That is not a rounding error. That is the difference between a business that survives and one that runs into a liquidity crisis at Month 20.
What You Get in Our Professional Coworking Space Financial Model:
- Tiered Membership Modeling — Hot Desk, Dedicated Desk, and Private Office each with independent ramp-up curves, pricing, and churn assumptions
- All Six Ancillary Revenue Drivers — Meeting rooms, business support, events, and virtual office services tied to active member count
- Complete 5-Year Financial Statements — Monthly and annual P&L, Cash Flow Statement, and Balance Sheet
- Startup Investment Summary — Full CapEx schedule for fit-out, equipment, and pre-revenue expenses
- DCF Valuation Module — Enterprise value calculation with sensitivity tables
- Investor-Ready Dashboard — KPI summary, occupancy charts, revenue breakdown visuals, and EBIT margin progression
- Fully Unlocked & Editable — Every formula visible, every assumption adjustable

Access the complete model: Coworking Space Financial Model Excel Template