
A Practitioner’s Guide to Structure, Dynamics & Professional Excel Modeling
Revenue Forecasting Is Not a Spreadsheet Exercise
Most people who try to build a financial model for a padel club business begin in the wrong place. They open excel, create a sheet called ‘Revenue‘, and start typing numbers. Within an hour, they have a tangle of hard-coded figures, inconsistent assumptions, and a model that collapses the moment any input changes.
I have built numerous financial models for sports facilities, hospitality businesses, and franchise networks for over a decade. The single most important lesson I can share is, a professional revenue forecast is not about numbers, it is about Structure and Dynamics. When those two foundations are correct, the numbers take care of themselves.
This guide will teach you how to think about your padel club’s revenue architecture the way a Certified Financial Modeler (FMVA®) would. We will cover input governance, seasonal occupancy mechanics, ancillary revenue logic, and event-based toggles. Where relevant, I will reference the exact structure used in our battle-tested Financial Projection Model For Padel Club.
Who This Guide Is For
Padel club founders, investors, and operators who need a defensible, auditable revenue forecast — whether for internal planning, a bank loan, or an investor deck. No advanced Excel knowledge is assumed, but intellectual curiosity is required.
Learn: 10 Excel Hacks Every Startup Founder Needs for Killer Revenue Forecasting
Section 1: The Two Pillars of a Professional Revenue Forecasting In Excel
Before writing a single formula, you must accept two non-negotiable principles:
Pillar 1: Structure: Inputs Drivers in One Place
In a professionally structured model, the Input Sheet is sacred. All assumptions, pricing, capacity, occupancy rates, churn, starting dates place in one dedicated tabs in excel, clearly labelled ‘Input Drivers’ Or ‘Driver Sheet’. Calculations can be elsewhere. Outputs formulation can be on other tabs in excel.
This is not a stylistic preference. It is what makes a model auditable, revisable, and stress-testable. When an investor asks, ‘What happens if weekday occupancy drops to 40%?’ you should be able to change one cell and watch every projection update instantly. If your assumptions are buried inside formulas across many sheets, that question becomes a debugging exercise.
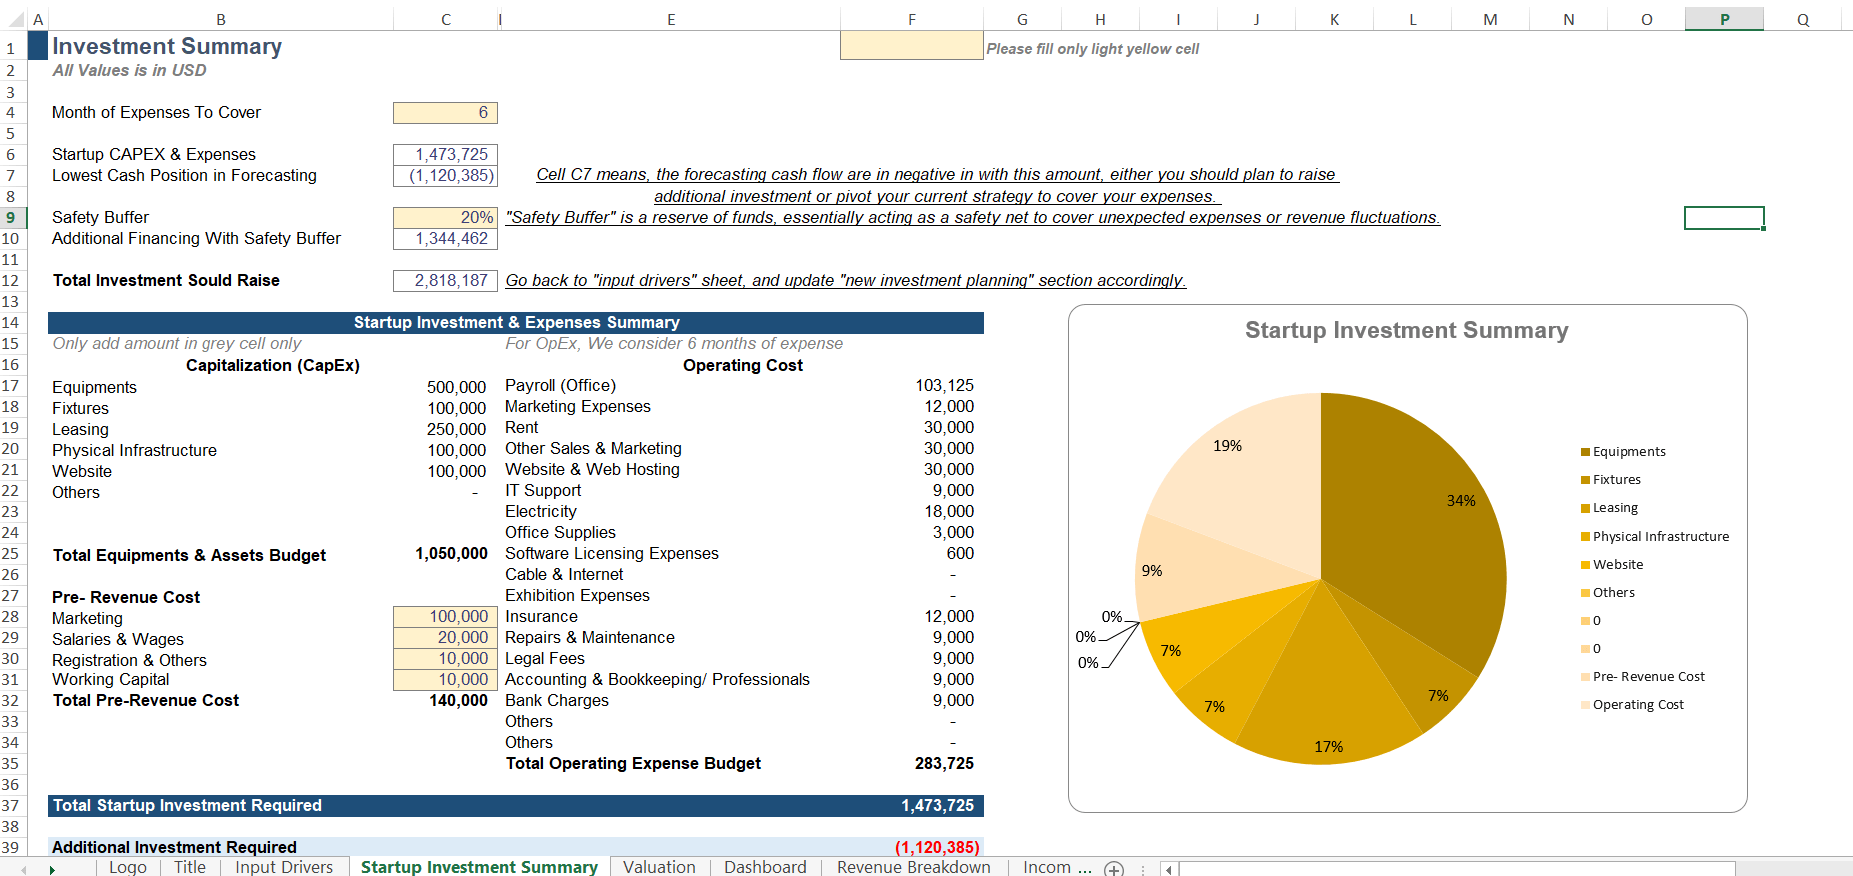
💡The Light Yellow Cell ConventionYou can notice in our Input Drivers sheet that every editable assumption is highlighted in a light cream cell, and the instruction ‘Please fill only yellow cells’ is displayed prominently at the top. This is deliberate. It tells any user i.e. a business partner, an accountant, an investor exactly where they are allowed to touch the model. Non-input cells are locked. This discipline prevents formula corruption and instils confidence.
Pillar 2: Dynamics: Nothing Is Hard-Coded
Hard-coding is the cardinal sin of financial modeling. A hard-coded number is a number typed directly into a formula. It looks harmless. It is lethal.
Example of hard-coding (wrong): = 3 * 15 * 12 * 0.65
Example of dynamic modeling (correct): = Courts* Price Per Hour * Hours Open * Occupancy Rate
Every figure in the second formula is a named driver sitting in the Input Sheet. Change one, and the entire five-year forecast adjusts. That is what dynamic modeling means — and it is the only standard acceptable for investor-grade work.
The drivers you must include for a padel club forecasting are;
- Number of courts (indoor vs. outdoor)
- Starting month of operations
- Number of players per game
- Average hours played per member per month
- Weekday and weekend pricing
- Occupancy rates by month
- Churn rate
- Ancillary revenue assumptions & Other assumption based on your revenue model, location & other dynamics.
If you are still determining your startup cost structure, our deep-dive on padel court startup costs provides a strong reference point for anchoring your CAPEX assumptions.
💡Further reading: Padel Court Startup Cost Guide
Section 2: Anatomy of the Input Drivers Sheet
Let us examine what a professional input sheet looks like in practice. The screenshot below is taken directly from our Padel Club Financial Model template specifically the Revenue Forecasting block.
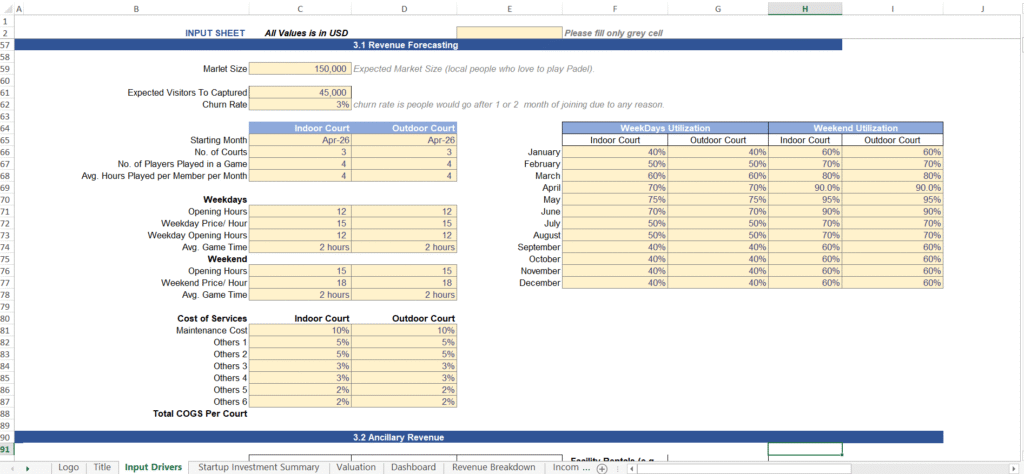
Several professional variable that are essential for forecasting revenue & decision making are visible:
2.1 Market Size and Capture Rate
The model begins at the market level not the court level. We input the Expected Market Size (local people who actively play padel) and the Expected Visitors to Capture. This top-down framing is essential when presenting to investors, who want to understand addressable demand before they will believe your occupancy assumptions.
A 3% Churn Rate is also parameterized here. This is the percentage of members who leave after one or two months. Ignoring churn is one of the most common and costly mistakes in subscription-based revenue models. A 3% monthly churn sounds modest; compounded over twelve months, it meaningfully erodes your membership base.
2.2 Court Configuration Inputs
The model has separate input assumptions for Indoor Courts and Outdoor Courts because they have different cost profiles, demand patterns, and pricing authority. Treating them as a single blended asset is imprecise. Each court type has its own starting month, number of courts, players per game, average hours per member per month, weekday and weekend opening hours, pricing per hour, and average game time.
Every one of these values sits in a light yellow colored input cell.
2.3 The Weighted Occupancy Matrix — The Most Important Table in the Model
Here is where amateur and professional models diverge most sharply. An amateur model uses a single occupancy percentage, say 65% and applies it uniformly across the entire year. A professional model recognizes that a padel club does not operate at a uniform rate. It operates in peaks and troughs, across weekdays and weekends, and across seasons.
Our model uses a 12-month Weighted Occupancy Matrix, split across four dimensions: Weekday Indoor, Weekday Outdoor, Weekend Indoor, and Weekend Outdoor. This gives twelve rows of monthly assumptions and four columns forty-eight individual data points that collectively paint an accurate picture of true utilization.
💡Why Weighted Occupancy MattersConsider a club with 60% average annual occupancy. If that figure masks 40% weekday utilization in January and 95% weekend utilization in May, a blended average will understate your peak revenue capacity and overstate your off-peak baseline. A weighted matrix captures this reality and produces a revenue curve that is credible to any seasoned investor.
The corresponding Cost of Services section with separate COGS lines for Maintenance, and five customizable ‘Others’ categories is equally important. Tying COGS directly to court type ensures that your gross margin calculation reflects actual operational reality, not a uniform assumption.
For a broader view of how padel clubs generate and lose money at a unit level, see our guide: How Padel Clubs Actually Make Money.
Section 3: Forecasting Ancillary Revenue — The Multiplier Effect
Court booking fees are the anchor revenue stream. But for a padel club to achieve strong unit economics, ancillary revenue streams must be modelled explicitly and dynamically. The screenshot below shows the Ancillary Revenue section of our input sheet:
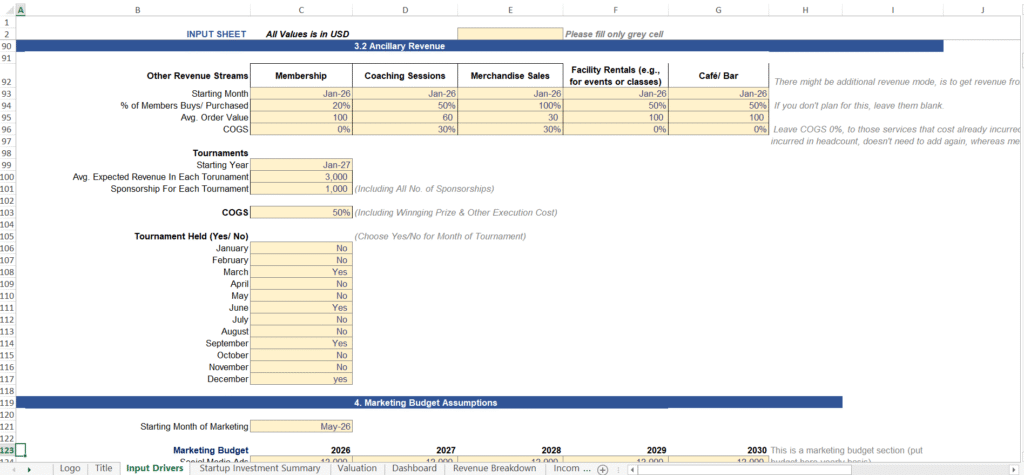
The model captures five ancillary streams: Membership fees, Coaching Sessions, Merchandise Sales, Facility Rentals, and Cafe/Bar revenue. Each stream follows the same professional logic structure:
- Starting Month: when does this stream begin generating revenue?
- % of Members Buys / Purchased: what fraction of your active member base will purchase this service in a given month?
- Order Value: what is the average transaction size for those who do purchase?
- COGS %: what percentage of that revenue is consumed by direct costs?
The Logic Chain: % of Members × Avg. Order Value
This is the professional formula that separates a realistic forecast from an aspirational one. Instead of simply estimating ‘Merchandise Sales = $3,000/month,’ we derive the figure from first principles:
Input Driver | Example Value | Output |
Active Members | 500 members in Month 6 | Base figure |
% Who Buy Merchandise | 100% (as per model default) | 500 buyers |
Avg. Order Value | $30 per transaction | $15,000 revenue |
COGS % | 30% (cost of goods) | $10,500 gross profit |
This logic scales automatically. As your membership base grows month-over-month (less churn), the ancillary revenue forecast grows in proportion without you manually updating a single figure. That is the power of a dynamic model.
Note also the COGS treatment: Membership and Facility Rentals carry 0% COGS because the costs are already embedded in your headcount and overheads. Coaching, Merchandise, and Cafe carry explicit COGS percentages. This nuance is what keeps your gross margin calculation honest.
Section 4: Modeling Event Revenue — Revenue From Tournament
Tournament and event revenue is, by nature, lumpy and irregular. It does not fit a smooth monthly curve. Amateur models either ignore it entirely or average it across twelve months both of which produce distorted forecasts.
The professional approach is a binary toggle: a Yes/No input for each calendar month. In our model, you will see exactly this pattern in the Tournament Held (Yes/No) section of the input sheet:
- January: No
- February: No
- March: Yes → Tournament logic activates; revenue recognized
- June: Yes → Tournament logic activates
- September: Yes → Tournament logic activates
- December: Yes → Tournament logic activates
When a month is toggled to ‘Yes’, the model automatically computes tournament revenue from three drivers: Average Expected Revenue per Tournament (including all ticket and entry income), Sponsorship Revenue for Each Tournament (all sponsorship packages combined), and a 50% COGS assumption (covering prize money and execution costs).
When a month is toggled to ‘No’, all tournament revenue lines produce zero cleanly and automatically. No manual zeroing required, no risk of formula errors.
💡Why This Matters for InvestorsA toggle-driven event model communicates two things to an investor:
(1) you understand that event revenue is episodic, not recurring.
(2) your model is flexible enough to test scenarios, ‘What if we run four tournaments instead of three?’ is answered by changing four cells, not rewriting formulas.
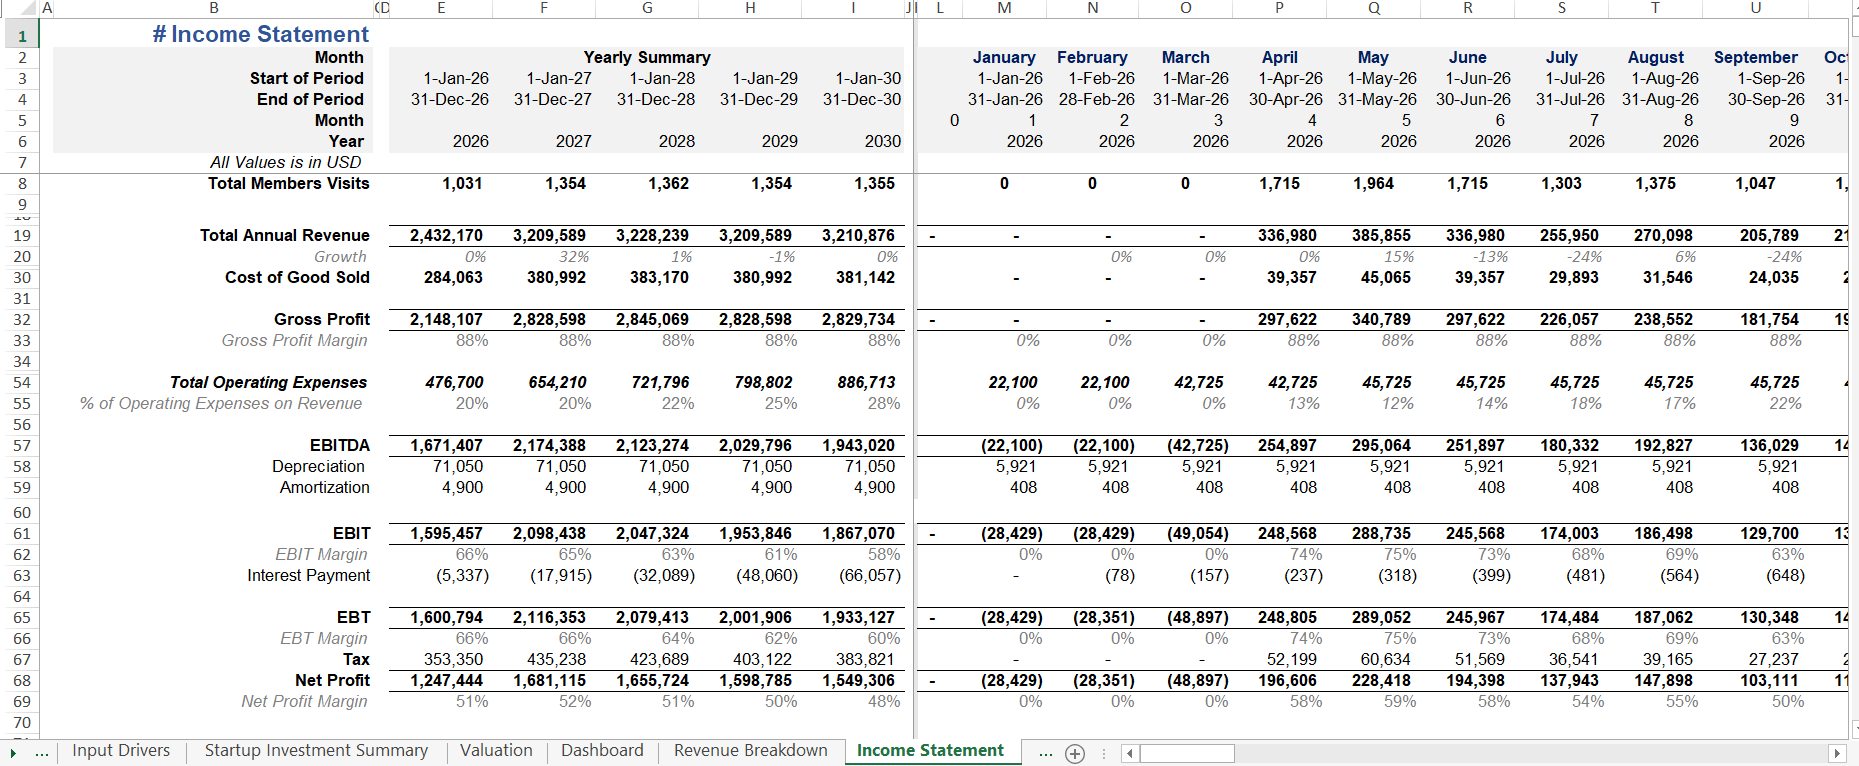
Section 5: From Inputs to Investor-Ready Outputs
A model that produces correct numbers but presents them poorly is only half-finished. The final professional step is translating your input logic into output dashboards that communicate value, risk, and opportunity to a non-technical audience.
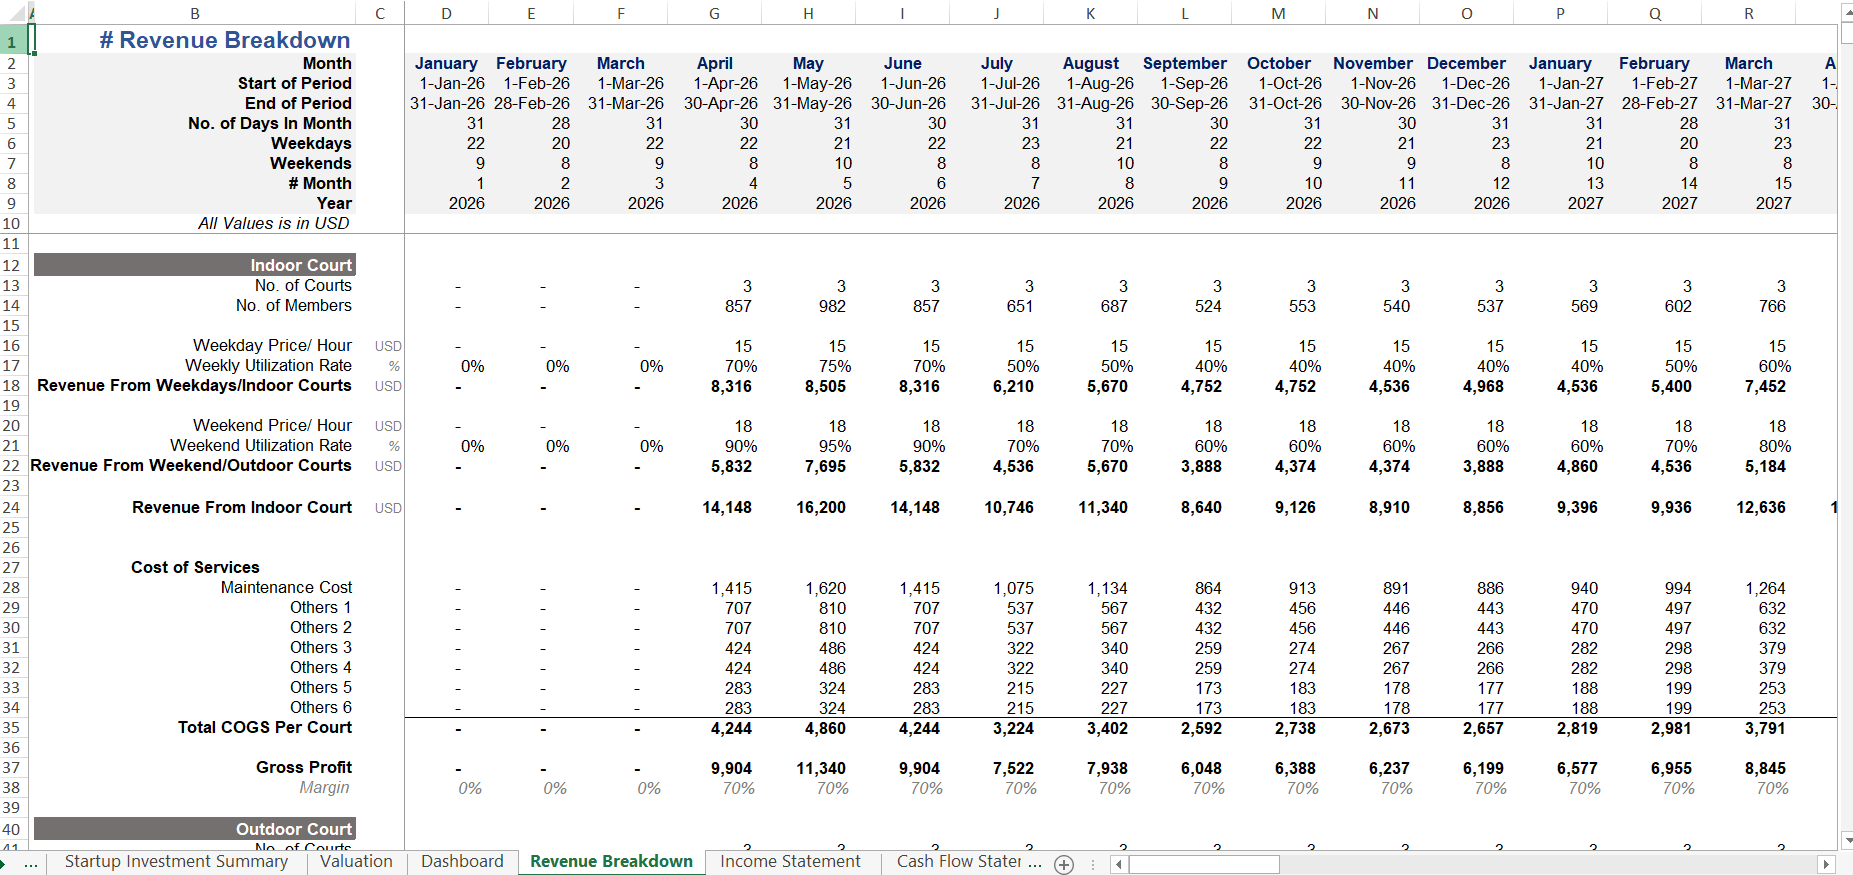
Below is a representative view of how a structured revenue model translates into a Revenue Breakdown dashboard:
An investor-grade dashboard should surface, at minimum: monthly and annual court revenue by type, ancillary revenue by stream, tournament revenue by event month, total gross revenue, COGS by category, gross profit and gross margin percentage, and year-on-year growth trajectory.
The investors and lenders who will scrutinize your model are not looking for complexity — they are looking for clarity and defensibility. Every figure on the dashboard should trace back, via a clean formula chain, to a single input cell. If it cannot, it should not be on the dashboard.
For a clear picture of the KPIs your investors will priorities, review our guide: Top 10 Padel Court KPIs Investors Care About.
Section 6: The True Complexity of a Professional Revenue Model
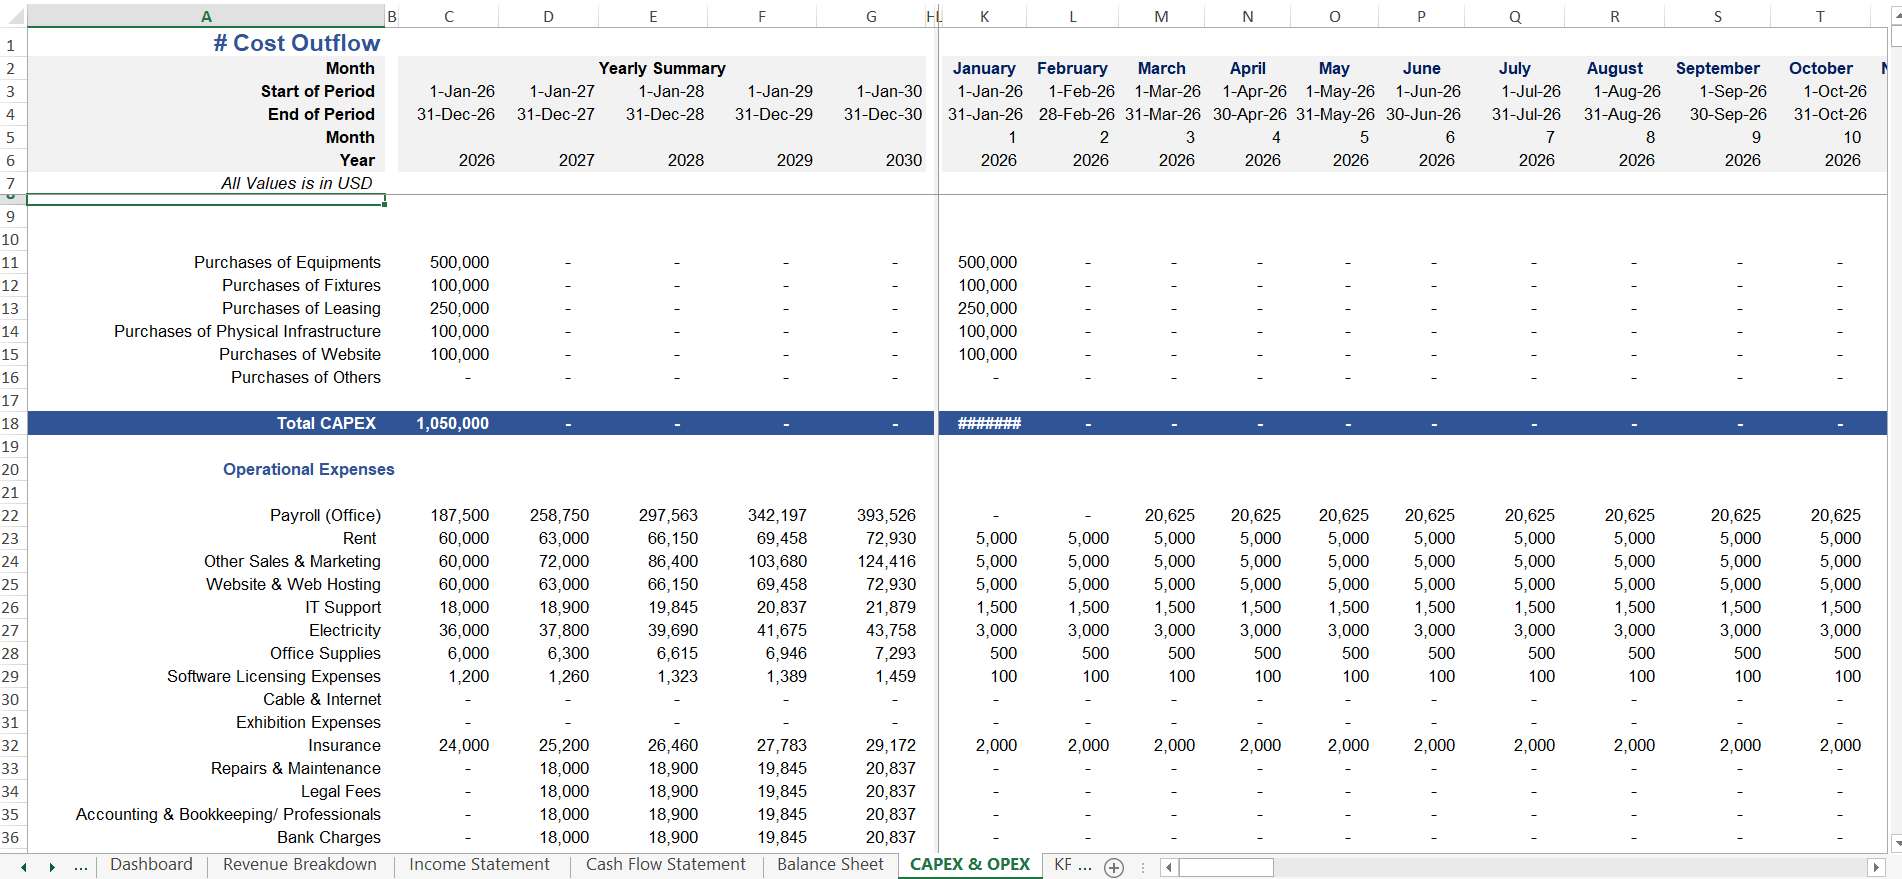
At this point, it is worth being candid about what we have covered and what we have not. The revenue forecast alone, built to the professional standard described in this guide, and requires the following components to be designed, built, and integrated:
- An Input Drivers Sheet with 80+ assumption drivers cells, correctly labelled and formatted.
- A Revenue Forecasting block with separate indoor/outdoor court logic and 48-cell occupancy matrices.
- A membership dynamics model with month-by-month acquisition and churn calculation.
- Five ancillary revenue streams, each with their own purchase rate, order value, and COGS logic.
- A tournament toggle system linked to average revenue and sponsorship drivers.
- A COGS framework that differentiates between variable and sunk-cost services.
- A Revenue Breakdown output sheet that aggregates all streams cleanly.
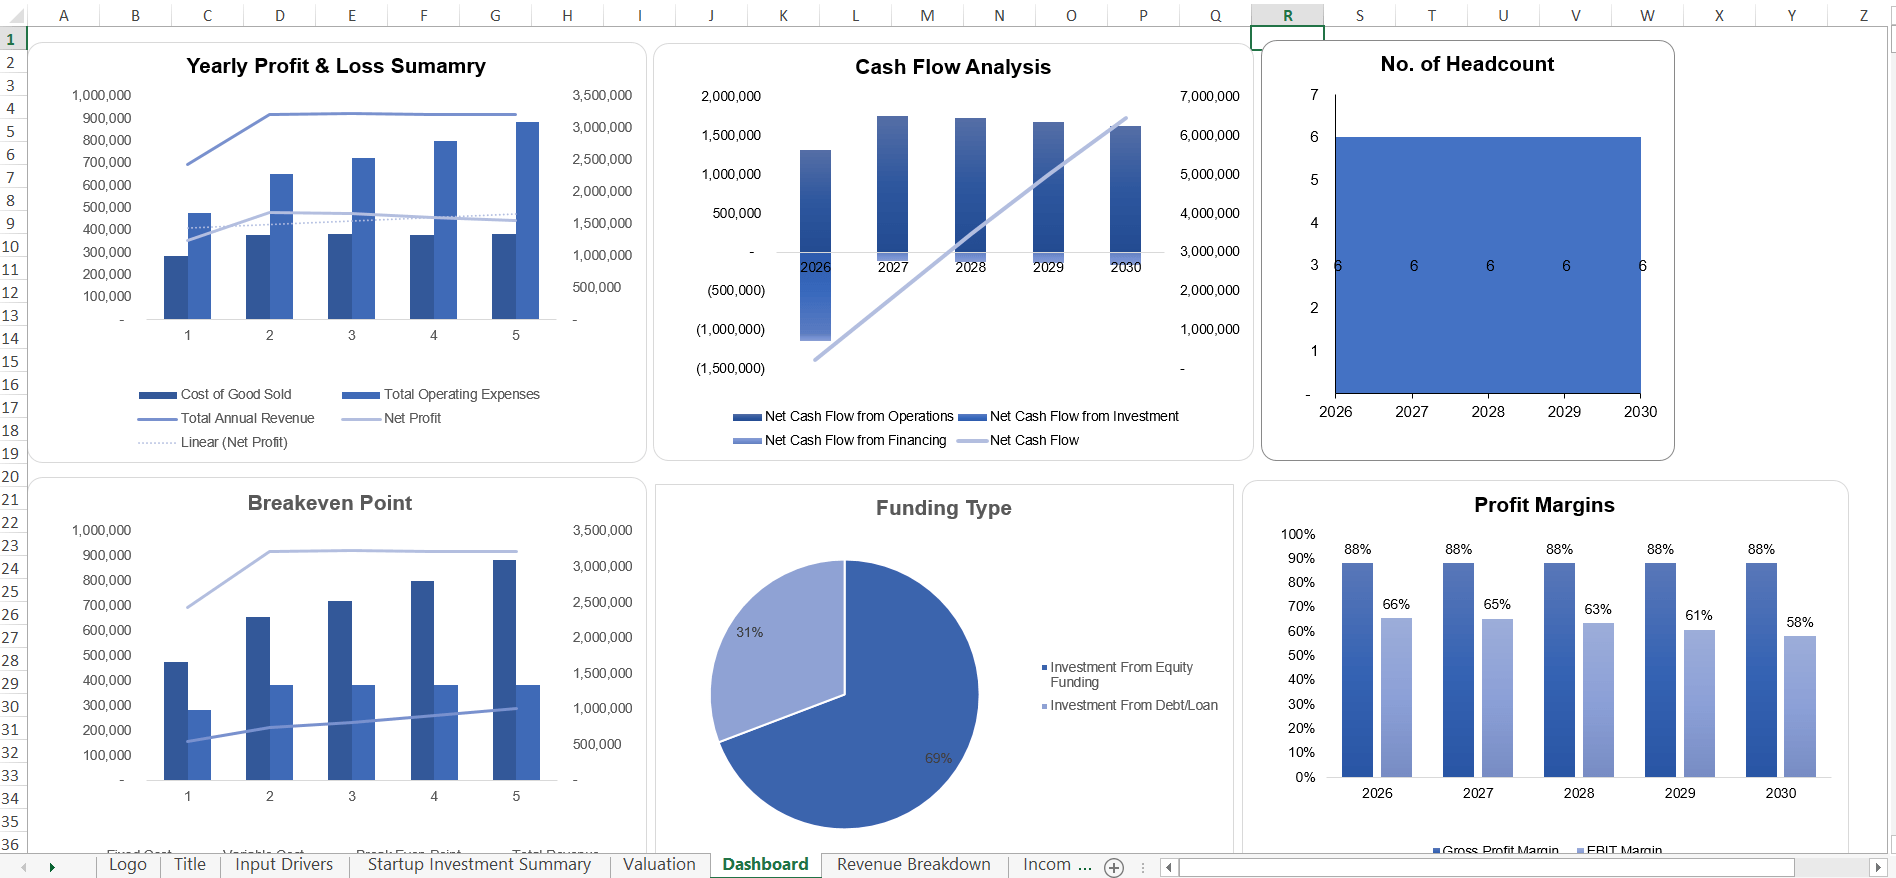
- A Dashboard that presents KPIs visually for investor consumption.
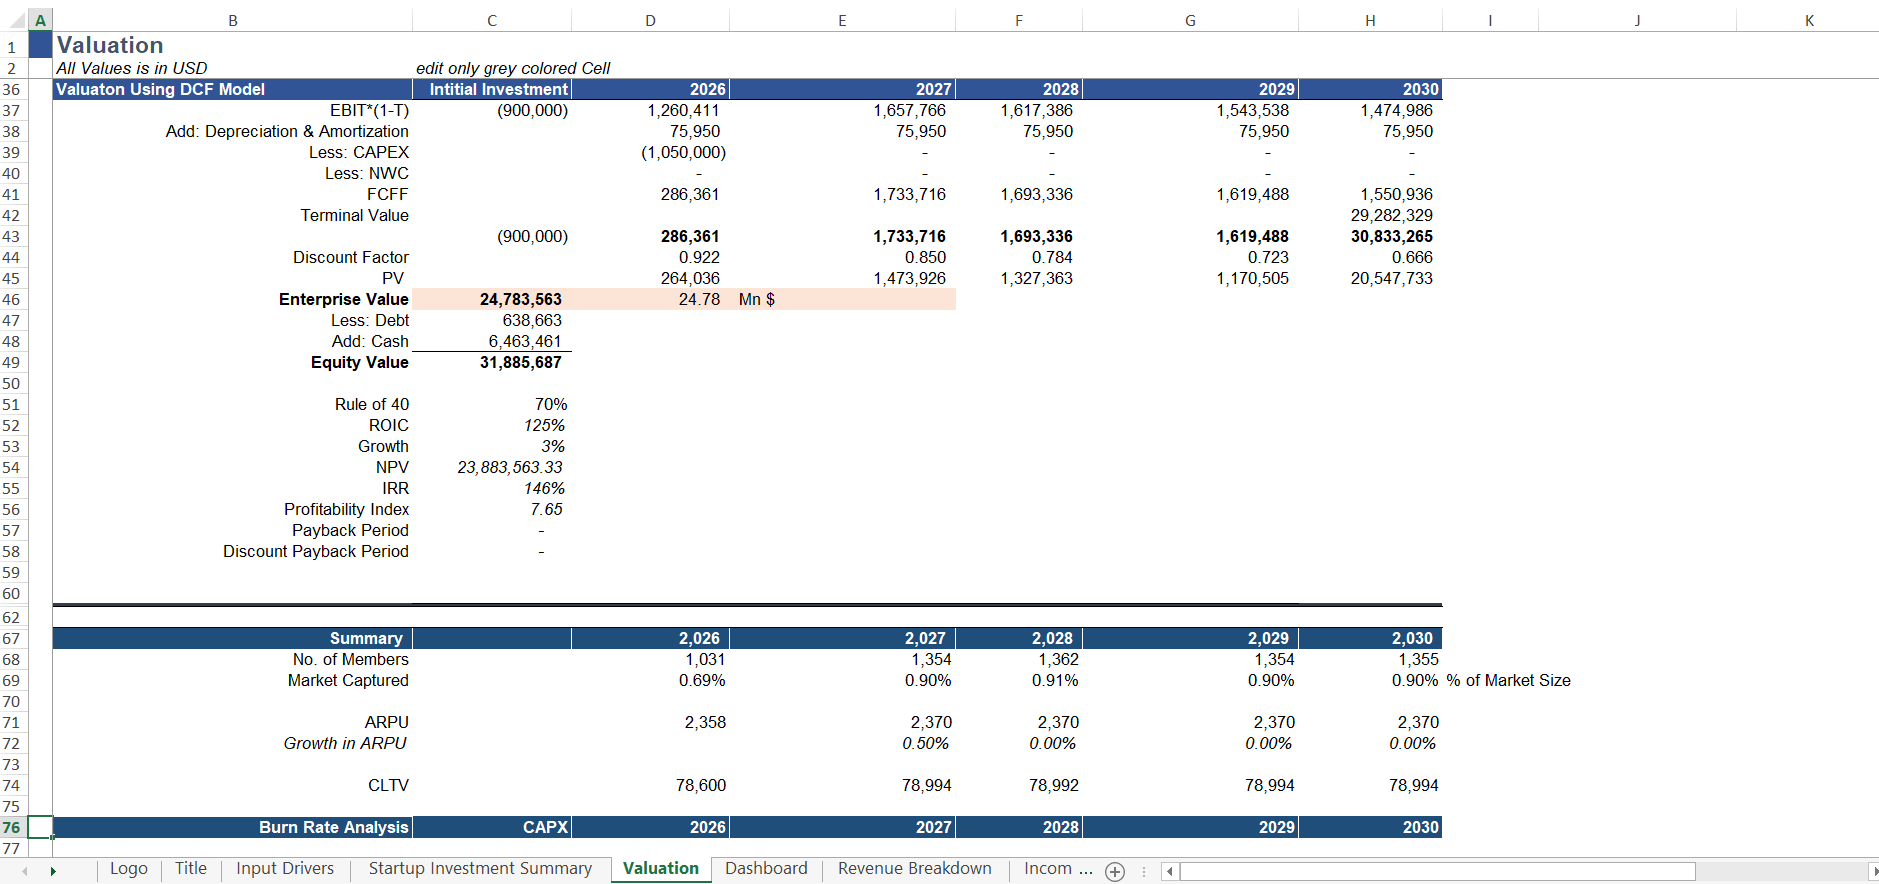
And this is before we discuss the full financial model: startup CAPEX, operational expenses, debt servicing, equity structure, five-year P&L, cash flow statements, and DCF valuation & other advance valuations outputs.
If you are at the stage of writing a full business plan, our Padel Club Business Plan guide provides the strategic framework that should accompany your financial model.
💡Skip 100+ Hours of Build Time
Building this logic from scratch handling seasonal curves, membership churn, and automated COGS takes even an expert 100+ hours. You can skip the technical struggle and start with a battle-tested framework.

What Is Included in the Padel Club Financial Model
The template is a fully integrated, 5 financial projection model built to the professional standard described throughout this guide. Here is a summary of what you receive:
Module | What It Does |
5-Year Monthly Projections | Full month-by-month P&L, Cash Flow & Balance Sheet for Years 1–5. |
Dynamic Scenario Toggles | Switch between Base, Optimistic, and Pessimistic cases in one click. |
CAPEX / OPEX Inputs | Itemised startup costs, asset depreciation, and operating expense drivers. |
Debt & Equity Planning | Model your funding mix — loans, investor equity, and repayment schedules. |
Investor-Ready Dashboards | Visual KPI summary page built for board decks and due-diligence packages. |
The model is delivered as an unlocked Excel file. Every formula is visible and auditable. All input cells are clearly labelled. Scenario toggles allow you to present Base, Optimistic, and Pessimistic cases from a single file.
Final Word: Build Right, or Build Twice
I have reviewed hundreds of financial models submitted by padel club founders seeking funding. The ones that succeed share a common quality: they are credible. Not because the numbers are high, but because every number can be explained, challenged, and defended.
Structure your inputs. Parameterize every driver. Build your occupancy matrix with seasonal granularity. Tie your ancillary revenue to your membership dynamics. Use toggles for event revenue. Present outputs on clean dashboards.
Do it right the first time, and your model becomes your most powerful fundraising tool. Do it wrong, and you will rebuild it from scratch when the first investor asks a hard question.
That is the professional standard. And now you know how to meet it.


