

If you’re planning to open a medical clinic, raise funding, attract a private equity partner, or eventually sell your practice you need to understand one thing clearly: investors don’t read marketing materials. They read KPIs.
The key metrics of a medical clinic business tell the story of how efficiently a clinic operates, how sustainably it generates revenue, and how much risk sits under the surface. An investor evaluating your clinic in 2025 will spend more time on your KPI dashboard than on your pitch deck.
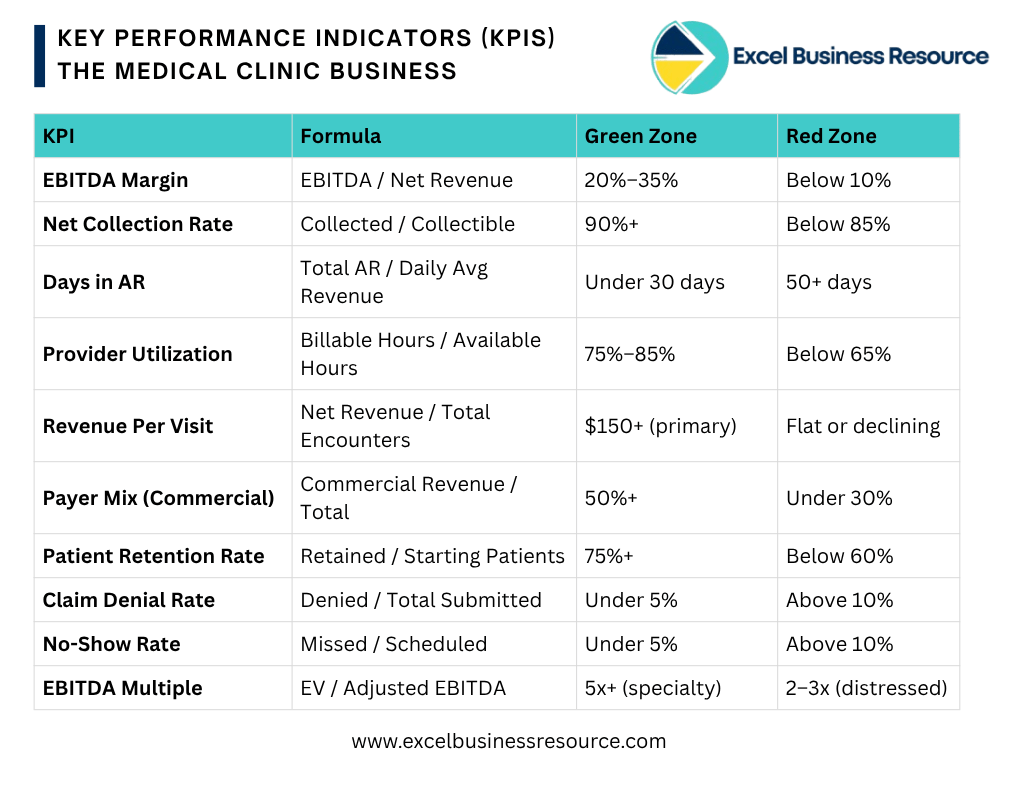
This guide breaks down the top 10 KPIs of medical clinic business that matter most to doctor comes entrepreneur, investors, lenders, and PE firms with benchmarks, formulas, and the honest explanation of what each number signals.
Whether you’re a physician going independent, an entrepreneur building a clinic group, or an investor doing due diligence, this is the data language you need to speak.
Before going into details of KPIs of medical care business, it is equally important to understand how a medical clinic business generate revenue. Once you understand the ways of making revenues for medical clinic, you will get better understanding of below KPIs.
Why KPIs Matter More Than Revenue Headlines
A clinic generating $500,000 per year isn’t automatically attractive. What matters is how it generates that revenue, how much of it survives as profit, and how dependent it is on any single provider or payer.
Buyers use KPIs like EBITDA margin to gauge a practice’s core profitability and operational efficiency. Days in Accounts Receivable indicate how quickly payments are collected — lower days suggest healthier cash flow. These metrics help buyers understand financial health and risk, influencing their valuation and offer.
Here’s the full picture of what they’re looking at.
KPI #1 — EBITDA Margin (The Headline Profitability Metric)
Formula: EBITDA / Net Revenue × 100
Benchmark: 15%–25% for outpatient clinics; 25%–35% for high-performing specialty clinics
EBITDA Margin is the first number any serious investor looks at. It shows how much profit a clinic generates from operations before financing and accounting decisions cloud the picture.
For well-run primary care and specialty groups, a healthy EBITDA margin is between 10% and 20%. Practices that sustain margins above this range often command premium valuations.
For outpatient centers specifically, the target EBITDA margin should be 15%–25%.
A clinic below 10% EBITDA is a yellow flag — overhead may be out of control, payer mix may be unfavorable, or billing is leaking revenue. Above 25% suggests either a strong service mix (specialty procedures, cash-pay) or exceptional cost discipline. This single metric does more to determine your valuation multiple than almost anything else.
Investor signal: A sustained EBITDA margin above 20% tells investors this clinic earns money whether the owner is in the building or not.
KPI #2 — Net Collection Rate (Your True Revenue Strength)
Formula: Payments Collected / (Total Charges – Contractual Adjustments) × 100
Benchmark: 90%+ is strong; below 85% is a red flag
Your gross billing number is almost always fictional. The Net Collection Rate reveals what you actually collect.
If a clinic collects $72,000 from $80,000 in collectible charges, it reaches a 90% collection rate and falls into a healthy performance range. Clinics under 85% often experience weak denial management, coding or documentation errors, and poor follow-up on patient balances.
If your net collection rate is falling below 90%, it generally reflects inadequate denial management or lost charge capture. To enhance it, practices need better front-end processes, enhanced denial prevention, and underpayment follow-up.
This KPI is one of the biggest separators between a well-run clinic and one that’s silently hemorrhaging cash. A 5-percentage-point improvement in Net Collection Rate on $1M in collectible charges is $50,000 in additional real revenue — with zero new patients.
Investor signal: A Net Collection Rate consistently above 90% demonstrates billing competence and tight revenue cycle management. Below 85% means the investor is buying a leaky bucket.
If you are ready the article, then you are curious about the medical clinic business.
Another Important topic is: Cost to start a medical clinic business & it’s profitability.
Read it.
KPI #3 — Days in Accounts Receivable (Cash Flow Velocity)
Formula: Total AR / (Annual Net Revenue / 365)
Benchmark: Under 30 days (high performer); 31–40 days (acceptable); 50+ days (problem)
This metric measures how long revenue sits uncollected after services are delivered. Insurance reimbursement cycles, billing errors, and payer disputes all push this number up.
High performers in 2025 have Days in AR of less than 30. The range of 31–40 is acceptable per industry groups like MGMA and AAFP. Over 50 days indicates cash flow issues of significant concern.
A firm with $500,000 in accounts receivable and $3 million in annual charges is sitting at over 60 Days in AR — a serious inefficiency that signals either poor billing processes or payer mix problems.
Investor signal: Days in AR is a direct proxy for cash flow health. A clinic at 35 days collects faster, needs less working capital, and carries less collection risk than one sitting at 65 days.
KPI #4 — Provider Utilization Rate (Capacity Efficiency)
Formula: Billable Patient Hours / Total Available Provider Hours × 100
Benchmark: 75%–85% for primary care; 80%+ for specialty
Your providers’ time is your clinic’s most expensive and most perishable asset. Every hour a provider isn’t seeing a patient is revenue that can never be recovered.
For capital-intensive service businesses like primary care clinics, achieving a Provider Utilization Rate toward the 80% target is critical. The primary cost driver — physician salaries — is largely fixed, so maximizing productive time directly impacts profitability.
Key metrics include Provider Utilization Rate, reviewed weekly. The primary revenue drivers are the number of active providers and the utilization rate, targeting 160 treatments per provider monthly.
A clinic at 60% utilization is paying for idle provider capacity. Moving from 65% to 80% utilization — without adding a single staff member — can generate an additional $8,000–$15,000 in monthly revenue per physician.
Investor signal: A utilization rate below 70% tells investors there’s either a scheduling problem, a patient volume problem, or both. Above 80% shows a clinic running on full engine.
KPI #5 — Revenue Per Patient Visit (Revenue Efficiency)
Formula: Total Net Revenue / Total Patient Encounters
Benchmark: $100–$250 (primary care); $150–$500+ (specialty); $400–$900 (cash-pay procedures)
This is the per-unit economics of your clinic — how much money you earn from each patient encounter. It’s directly tied to your service mix, billing codes, and ancillary revenue capture.
General consultations form the foundation of clinic revenue, generating $100 to $200 per patient visit. Specialty services represent the most profitable segment, with regenerative therapy, aesthetic treatments, and medspa services commanding $400 to $900 per procedure.
The gap between a clinic at $120/visit and $220/visit often isn’t volume — it’s whether ancillary services (labs, imaging, procedures) are being captured in-house or referred out.
Investor signal: A rising Revenue Per Visit trend tells investors the clinic is optimizing its service mix and capturing more value from each patient interaction. A flat or declining number signals pricing pressure or underutilization of ancillary capabilities.
KPI #6 — Payer Mix (Revenue Quality and Valuation Driver)
Formula: Revenue by payer category (Commercial Insurance / Medicare / Medicaid / Cash-Pay) as % of total
Benchmark: Commercial insurance > 50% is preferred; Medicaid > 40% raises valuation concerns
Payer mix is one of the most consequential and often underappreciated KPIs in a medical clinic business. It determines not just how much you earn, but how stable and collectible that revenue is.
Commercial payers typically reimburse at rates 89% higher than Medicare, creating substantial valuation differences between practices with varying payer compositions.
Practices with predominantly commercial payer mix may achieve 40–60% higher valuation multiples. Medicaid-heavy medical practices face valuation discounts due to potential rate reductions. Cash-pay specialties show the widest multiple ranges based on market positioning.
A clinic where no single insurance provider accounts for more than 30% of revenue is also a safer bet for investors — concentration risk in payer mix is a due diligence red flag.
Investor signal: A clinic with 55–60% commercial insurance and 15–20% cash-pay revenue is a premium asset. One heavily dependent on Medicaid reimbursement will face valuation discounts and investor skepticism about future rate stability.
KPI #7 — Patient Retention Rate (Revenue Predictability)
Formula: (Active Patients at Period End – New Patients) / Active Patients at Period Start × 100
Benchmark: 70%+ is solid; 80%+ is strong; below 60% signals service quality issues
Patient retention is one of the most powerful indicators of a clinic’s long-term revenue durability. Retaining an existing patient costs significantly less than acquiring a new one — and retained patients visit more frequently, accept more services, and refer others.
Investors evaluate Physician Retention Rate as the most critical metric for operational stability. When evaluating a clinic investment, institutional analysts focus on Patient Lifetime Value (LTV) and Payer Mix stability as primary investment criteria.
A clinic with high patient churn is constantly running to stand still — spending on acquisition to replace lost revenue rather than growing from a stable base.
Investor signal: A retention rate above 75% means the clinic has built real patient loyalty — a defensible competitive position that makes future revenue predictable. For investors, predictability reduces risk and increases valuation.
KPI #8 — Claim Denial Rate (Billing Process Quality)
Formula: (Number of Claims Denied / Total Claims Submitted) × 100
Benchmark: Under 5% is target; under 3% is top performer; 12–15% is industry average
The claim denial rate exposes the quality of your billing and documentation processes. High denial rates mean delays in cash flow, higher administrative costs to rework and resubmit, and in some cases, revenue that’s never recovered.
Denial rates are 12–15% across the industry, but providers should target under 5%, and top performers are under 3%. One U.S. clinic reduced denials from 14% to 4% within a year of installing denial prediction software and saved over $150,000 each year.
A denial rate above 10% is a double problem: lost revenue and inflated administrative costs to chase those denials.
Investor signal: A low denial rate (under 5%) signals tight coding practices, clean documentation, and a billing team that gets it right the first time. A high rate tells investors there’s a hidden cost center eating into margins.
KPI #9 — No-Show Rate (Operational Waste)
Formula: (Missed Appointments / Total Scheduled Appointments) × 100
Benchmark: Under 5% is well-managed; 8–10% is a revenue risk; above 10% is a systemic problem
Every missed appointment is a direct revenue loss. A provider slot at 10:00am that goes unfilled is $100–$500 in revenue permanently evaporated — the overhead (rent, utilities, staff) still runs whether the patient shows up or not.
An 8 to 10% no-show rate can lead to large revenue loss in the form of tens of thousands of dollars in unused capacity per year. Well-designed systems use text reminders, telehealth options, and predictive analytics to bring no-show rates below 5%.
A clinic seeing 25 patients per day at $175 average revenue with a 10% no-show rate is losing 2.5 slots daily — roughly $160,000 in annual revenue that simply doesn’t exist.
Investor signal: A no-show rate above 10% tells investors there’s a scheduling and engagement problem. Under 5% signals a clinic with a reliable patient base and strong operational systems.
KPI #10 — EBITDA Multiple / Clinic Valuation (The Exit Score)
Formula: Enterprise Value / Adjusted EBITDA
Benchmark: Primary Care: 3–5x EBITDA; Specialty: 6–11x EBITDA; High-performing specialty: up to 14x
This KPI matters most to investors evaluating a clinic as an acquisition or investment target — and it should matter to every clinic founder who plans to eventually exit.
In 2025, quality clinics are trading at 10× to 14× EBITDA, depending on specialty and geographic dominance.
Valuation multiples by specialty include: Primary Care at 3–5x EBITDA; Dermatology at 6–8x; Orthopedics at 7–10x; Oncology at 8.0–8.5x; Cardiology at 8–11x EBITDA — reflecting strong reimbursement and high buyer competition.
Ancillary income is critical: facilities or practices with imaging, diagnostics, or ambulatory surgery center ownership can achieve 25–40% higher revenue multiples than peers limited to professional fees.
Every KPI discussed above directly influences where your clinic lands on this valuation range. A clinic with strong EBITDA margin, high net collection rate, low Days in AR, diverse payer mix, and an 80%+ utilization rate will command 2–4x more in a transaction than an operationally weak clinic with identical revenue.
Investor signal: This is the scoreboard. Every KPI upstream feeds into this final multiple. Investors use it to assess what the clinic is worth today and what it could be worth after operational improvements.
How to Track These KPIs Before You're Investor-Ready
Here’s the thing most clinic founders miss: investors don’t trust KPIs you calculate ad hoc. They trust systems.
If your KPIs live in your EHR, your billing software, and a spreadsheet that hasn’t been updated since last quarter that’s a problem. An investor doing due diligence wants to see a clean, consistent KPI history, ideally going back 24–36 months.
That starts with building your financial infrastructure from Day 1. At Excel Business Resource, we’ve helped 100+ startups and healthcare businesses set up financial systems that are investor-ready from the start. Our Medical Clinic Financial Model Excel Template is specifically designed to track, project, and present every KPI an investor will ask about.
The template includes:
- KPI dashboard with all 10 metrics above, auto-calculated from your inputs
- 5-year financial projections with monthly revenue, EBITDA, and cash flow views
- Revenue driver modeling by service line — so you can see how payer mix or service mix changes affect your KPIs
- Break-even analysis and burn rate analysis by month
- DCF Valuation output — showing your clinic’s investor-ready value under different scenarios
- Working capital forecasting and payer mix sensitivity analysis
- Fully editable — no accounting background required

This is the same financial infrastructure we build for our clients seeking investment, planning an exit, or simply managing their clinic like a real business.
Final Thoughts
KPIs aren’t just numbers for reporting purposes. They’re the language investors use to decide whether your clinic is worth their capital and how much they’re willing to pay for it.
The 10 metrics in this guide cover every dimension investors scrutinize: profitability, cash flow efficiency, operational capacity, revenue quality, and valuation multiple. A clinic that tracks and actively improves these metrics isn’t just running better — it’s worth significantly more.
If you’re serious about building a clinic that attracts investors, commands a premium valuation, or simply runs at peak efficiency, start with the numbers. Build your unit economics properly. Model your revenue drivers of medical clinic business from Day 1. And track every KPI on a dashboard that gives you and any investor – complete visibility.
Excel Business Resource has worked with 100+ startups and healthcare businesses on financial modeling, FP&A, and business planning. Explore our full range of startup financial model templates, including our specialized healthcare business financial model for clinic founders and investors.