Opening a coffee shop sounds exciting — the aroma, the regulars, the community vibe. But here’s the hard truth: 50–75% of independent coffee shops close within the first five years (Gitnux, 2025). Most don’t fail because the coffee is bad. They fail because the numbers aren’t tracked.
If you’re serious about building a profitable café, you need to understand the metrics that actually drive coffee business profit — not just revenue on paper, but the real financial levers that separate thriving shops from ones that quietly shut their doors. Whether you’re planning how to start a coffee shop or already running one, this guide gives you the exact KPIs of coffee shop businesses that matter.
At Excel Business Resource, we’ve worked with 100+ startups on financial modeling and FP&A. Here’s what the data actually tells us.
Why Most Coffee Shop Owners Track the Wrong Numbers
Many café owners obsess over daily sales or Instagram likes. But raw revenue without context is misleading. A shop pulling $25,000/month can still be bleeding cash if labor is eating 48% of it.
The U.S. coffee shop market was valued at $54 billion in 2024 and is projected to reach $72 billion by 2028 (CoffeeDasher, 2025). That’s a massive opportunity but only for owners who understand their unit economics.
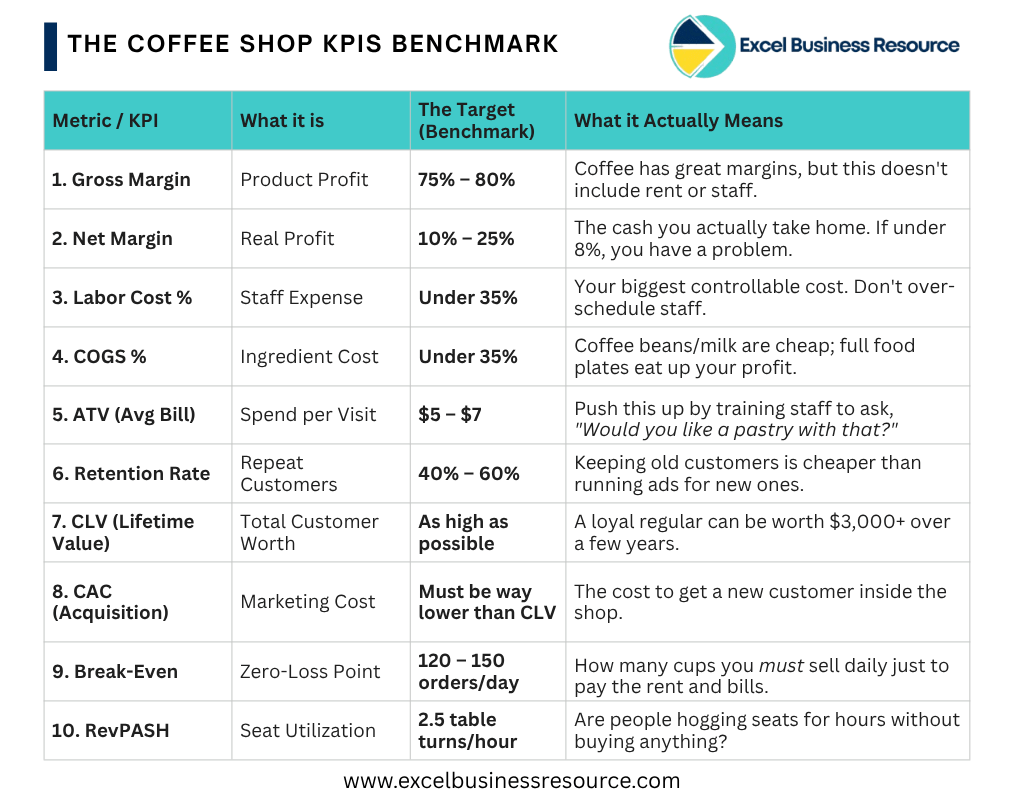
Let’s break down the 10 metrics you actually need.
1. Gross Profit Margin — Your Product’s True Profitability:
Formula: (Revenue – COGS) / Revenue × 100
This is where most coffee businesses start strong. The gross margin for most coffee shops sits between 75–80% (Beans & Brews, 2025), which is excellent compared to traditional restaurants. Specialty beverage shops can even hit 65–80% on individual drinks.
But gross margin only tells you the cost of the product. It doesn’t account for rent, staff, or utilities. A 75% gross margin can still yield a 2% net margin if your operating costs aren’t controlled.
Action step: Keep your COGS (coffee, milk, syrups, packaging) under 35% of revenue as a hard benchmark.
2. Net Profit Margin — The Real Bottom Line:
Formula: Net Income / Total Revenue × 100
This is the number that tells you if the business is actually sustainable. Industry benchmarks vary widely:
- Independent shops average 13.8% net margin, with most landing between 10–25%.
- Broader industry data puts the average at 6–18% (CoffeeDasher, 2025)
- Underperforming shops land closer to 2–6%, often due to uncontrolled labor and rent
For a coffee shop budget analysis, the net margin is your true north. If you’re not hitting at least 8–10%, something in your cost structure needs attention — usually labor or occupancy costs.
3. Labor Cost Percentage — Your Biggest Controllable Expense:
Formula: Total Labor Costs / Total Revenue × 100
Labor is the largest and most volatile cost in any café. Industry data shows labor typically consumes 35–45% of total operational costs. The turnover rate for hourly café employees runs around 150% annually — meaning you’re essentially replacing your entire team every eight months.
That makes smart scheduling and staff retention one of the most underrated profit drivers. Tracking revenue per labor hour helps you identify your busiest windows and schedule accordingly. The 2025 Independent Coffee Shop Report found that 75% of shop owners cited staffing as their single biggest concern.
Benchmark to hit: Keep labor cost below 35% of revenue where possible.
4. Average Transaction Value (ATV) — The Upsell Multiplier:
Formula: Total Revenue / Number of Transactions
The average coffee shop transaction value in the U.S. sits between $5–$7. Doesn’t sound like much — but even moving the needle by $1.50 per transaction can meaningfully shift your monthly revenue.
How do you increase ATV without annoying customers? Train staff to suggest add-ons (an extra shot, a pastry pairing, a specialty milk upgrade). Build a menu that makes the $7 option feel natural. Introduce seasonal drinks that command premium pricing.
If your ATV is under $5, your menu pricing or upsell strategy likely needs a rethink.
5. Customer Retention Rate — The Metric Worth More Than Any Ad:
Formula: ((End Customers – New Customers) / Starting Customers) × 100
Most coffee shops focus on getting new customers. Experienced operators focus on keeping them. The average customer retention rate in the coffee shop industry is approximately 25–30% (Gitnux, 2025), but well-run independent cafés with loyalty programs can push this to 40–60% (StartupFinancialProjection, 2025).
Why does this matter so much? Repeat customers spend 67% more than first-time visitors. Loyalty programs can boost retention by over 20%, and 49% of loyalty members report spending more after joining one (StartupFinancialProjection, 2025).
This is pure profit leverage with very little extra cost.
6. Customer Lifetime Value (CLV) — Think Long-Term, Not Per-Visit:
Formula: Average Visit Spend × Visits Per Year × Average Customer Lifespan (years)
Here’s a quick example that changes how you think about marketing:
A regular who visits twice a week, spends $8 each visit, and stays loyal for four years is worth $3,328 in total revenue (StartupFinancialProjection, 2025).
Now ask yourself: is spending $15–20 to acquire that customer through a loyalty app, a referral program, or a grand opening promotion actually expensive? Not when you frame it against CLV.
CLV is the backbone of smart coffee cafe business financial planning. It helps you decide how much to spend on marketing, how aggressively to invest in retention, and whether your current customer base is growing in value.
7. Break-Even Point — When Does the Profit Timeline Actually Start?
Formula: Fixed Costs / Gross Margin Percentage
The average startup cost for a coffee shop with seating is between $200,000 and $375,000 (Gitnux, 2025). Knowing your break-even point tells you how long the profit timeline of your coffee shop business actually is — and what daily/weekly revenue you need to hit to reach it.
Many new café owners are surprised to find their break-even requires 120–150+ covers a day. That number needs to be stress-tested before you sign a lease, not after.
This is where a proper Coffee Shop Financial Forecasting Model becomes genuinely useful. You can map out your break-even scenarios, test different pricing strategies, and stress-test your assumptions before committing real capital.
8. Cost of Goods Sold (COGS) Percentage — Watch the Ingredient Creep:
Formula: Total COGS / Total Revenue × 100
For a well-run café, COGS should sit under 35% of revenue (Gitnux, 2025). When it creeps above that due to supplier price increases, waste, over-portioning, or menu complexity — your gross margin shrinks fast.
Artisanal coffee beverages typically carry a 75–85% contribution margin before labor. But full food plates can drop to 40–50% due to ingredient complexity. If your menu mix shifts too heavily toward low-margin food items, your overall profitability drops even when revenue looks healthy.
Regular menu engineering auditing which items sell well AND contribute strong margins — is a key discipline in coffee shop budget analysis.
9. Revenue Per Available Seat Hour (RevPASH) — Making Every Seat Work:
Formula: Total Revenue / (Available Seats × Operating Hours)
RevPASH is the metric that tells you how hard each seat in your café is actually working. It’s widely used in restaurant financial modeling, and coffee shops with seating should track it just as closely.
A high RevPASH means your layout, table turnover, and peak-hour management are working. A low one means you might have too much underutilized space, slow table turns, or a mismatch between your busy hours and staffing levels.
During peak periods, a healthy benchmark is 2.5 table turns per hour (StartupFinancialProjection, 2025). If you’re below that, look at your seating layout, order speed, or whether your pricing encourages lingering over quick visits.
10. Customer Acquisition Cost (CAC) — What Does a New Customer Actually Cost?
Formula: Total Marketing & Sales Spend / Number of New Customers Acquired
Most independent café owners spend on marketing without knowing if it’s working. CAC tells you exactly what you’re paying to bring a new customer through the door — and when you compare it against CLV, you immediately know whether your marketing is profitable or just expensive.
If your CAC is $12 and your CLV is $800, you have a strong engine. If your CAC is $40 and most customers don’t return, you have a leak.
Tracking CAC also helps you compare channels — does Instagram convert better than Google ads? Is your loyalty program cheaper at acquiring regulars than paid promotions?
Why You Need a Financial Model For Coffee Business
Tracking these 10 metrics in isolation helps. But seeing how they interact — how a 1% improvement in labor cost flows through to net margin, or what increasing ATV by $2 does to your annual EBITDA requires a proper financial model.
Despite real pressures from inflation and staffing, 68% of independent coffee shop owners reported stable or growing revenue in 2024 (CoffeeShopKeys, 2025). The ones who grow aren’t just grinding harder. They’re using data to make better decisions.
If you’re writing a business plan for a coffee shop business, seeking investor funding, or simply trying to understand whether your café is on track, having an investment-ready financial model is non-negotiable.
Our Coffee Shop Financial Model Excel Template is built specifically for café operators and investors. It includes:
- Revenue projections based on footfall, ATV, and transaction volume
- Break-even analysis with sensitivity scenarios
- Labor and COGS modeling tied to real operating variables
- Monthly P&L, cash flow, and balance sheet forecasts
- KPI dashboard tracking the exact metrics covered in this article
Whether you’re planning how to start a coffee shop or optimizing a café already in operation, this coffee shop financial forecasting model gives you the clarity to make decisions with confidence — not guesswork.
Final Thoughts
The profitability of a coffee business isn’t magic — it’s metrics. The shops that thrive long-term are the ones that know their numbers, track them consistently, and act on what the data shows.
Start with gross margin and net margin to understand your financial baseline. Add labor cost tracking and ATV to identify your biggest levers. Build CLV and retention into your growth strategy. And use a solid coffee shop financial projection model to tie it all together.
If you’re looking for more tools on startup financial modeling, unit economics, or burn rate analysis, explore the full resource library at Excel Business Resource.