
Biotechnology is no longer a niche corner of healthcare. It touches medicine, food, energy, and industry all at once. If you are a founder building a biotech startup or an investor scanning the sector for the next opportunity, you need numbers you can trust, not just a single headline figure.
This biotechnology market research report pulls data from independent research firms, compares their numbers side by side, and explains what the gap between them actually means. You will also see where the money is flowing, which regions are pulling ahead, and what this data means for your next funding round or investment decision.
Biotechnology Market Outlook:
Before the detail, here is the single table most readers actually want. Bookmark this section if you only need the headline picture.
| Metric | EBR Estimate | What It Means |
|---|---|---|
Global market size, 2025 |
$1.81 trillion |
EBR’s working figure, sitting near the middle of six independent research estimates |
Global market size, 2035 |
$6.46 trillion |
Roughly 3.6 times today’s market over ten years |
Compound annual growth rate |
13.6% |
Around five times faster than average global GDP growth |
Largest region |
North America, 35% share |
Driven by deep venture capital pools and FDA approval pathways |
Fastest growing region |
Asia Pacific |
China’s out licensing deals alone hit $56.7 billion in the first quarter of 2026 |
Largest single country market |
United States |
$0.85 trillion in 2025, heading to $3.23 trillion by 2035 |
Largest application segment |
Bio Pharmacy |
$758.87 billion in 2025, growing toward $2.71 trillion by 2035 |
Fastest growing application segment |
Bioinformatics |
13.2% CAGR through the forecast period |
Global VC funding into biopharma, 2025 |
$33.8 billion |
Down from a 2021 peak of $53.9 billion, but recovering for a second straight year |
Average cost to bring one drug to market |
$2.3 billion |
The single biggest reason biotech valuation works differently from other startup sectors |
Everything below explains where each of these numbers comes from and, more importantly, what they mean for the decision you are actually trying to make.
How Big Is the Biotechnology Market in 2026?
EBR estimates the global biotechnology market at $1.81 trillion in 2025, expected to reach $6.46 trillion by 2035, growing at a CAGR of 13.6%.
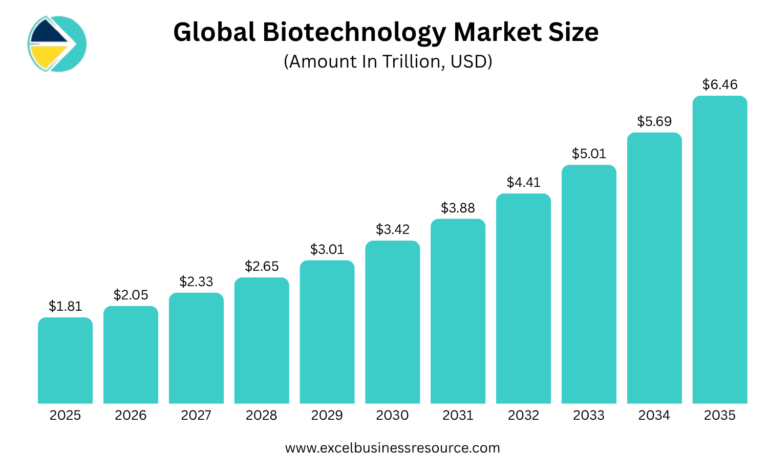
EBR also studies the data published by other research firms and consolidates their estimates into one clear number. This matters because different firms scope the market differently. Some count only medical biotech. Others also include agriculture, industrial biotech, and bioinformatics tools. That is why the same global biotech market can show up as $1.5 trillion in one report and $2.8 trillion in another, even though both reports are correct within their own scope.
Here is how six leading research firms size the global biotechnology market for 2026 and beyond.
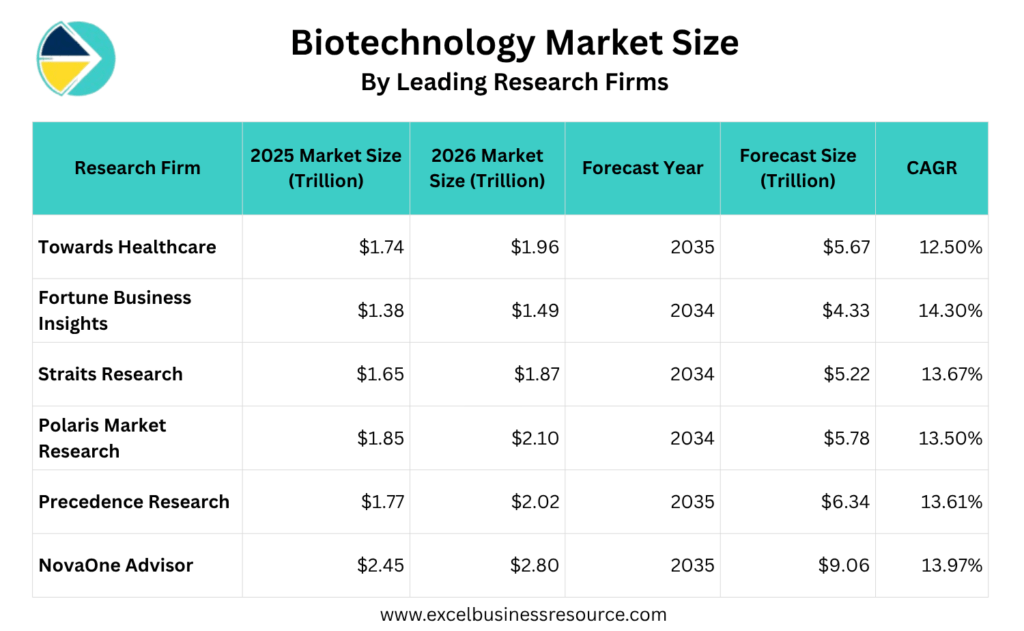
Take the midpoint of these estimates and a reasonable working number for 2026 sits somewhere between $1.5 trillion and $2 trillion globally, expanding at a compound annual growth rate of roughly 12% to 14% through the mid 2030s. EBR’s own figure of $1.81 trillion fits comfortably inside that band, which is exactly why it is the number used as the base case throughout the rest of this report.
Biotechnology Market Share by Region:
| Biotechnology Market Size By Region | Market Share |
|---|---|
North America |
35% |
Europe |
25% |
Asia Pacific |
20% |
Latin America |
10% |
Middle East and Africa |
10% |
Reference: statifacts
North America:
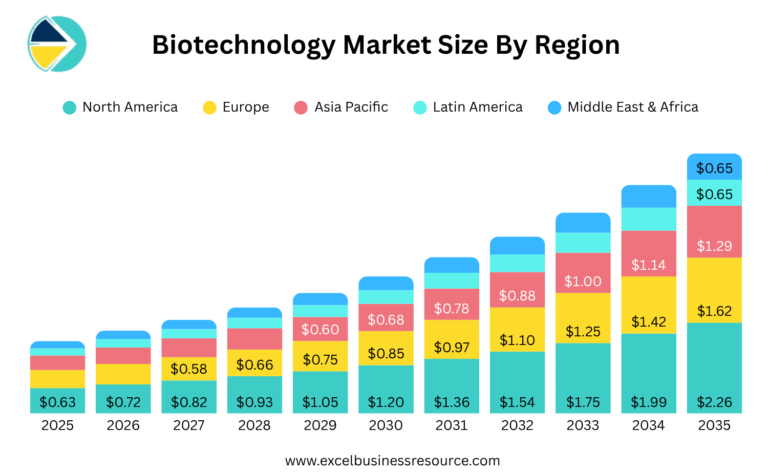
North America currently stands somewhere $0.63 trillion, and expect to be at $2.26 trillion by 2035.
North America’s 35% share is anchored almost entirely by the United States. USA outproduces the entire European continent on most vendor scopes, and it explains why North America still leads despite slower growth than Asia Pacific.
Europe:
As per the research, Europe market size is $0.45 trillion in 2025 & expect to be $1.62 trillion in 2035, with CAGR of around 13%.
Europe’s 25% share is real but uneven across the continent. The United Kingdom alone was valued at $23.6 billion in 2025 by IMARC Group, projected to reach $42.9 billion by 2034 at a 6.65% CAGR.
Asia Pacific:
Asia Pacific regions seems to be fast growing market. In 2025, it’s markt size is $0.36 trillion in 2025 & expected to be at $1.29 trillion in 2035.
Asia Pacific’s capture 20% market share mainly due to China. China’s biopharmaceutical’s licensing deals alone reached $137.7 billion in 2025 (source finance.yahoo.com), a nearly 10x increase from 2021, and had already hit $56.7 billion in the first quarter of 2026, up 132% year over year. Over 30% of China’s innovative drug pipeline now originates from domestic biopharma firms, positioning the country as the world’s second largest hub for biopharmaceutical development.
Latin America:
Latin America holds a 10% share of the global biotech market. This region currently stands at around $0.18 trillion, and is expected to reach $0.65 trillion by 2035.
Brazil leads this region by a wide margin, valued at $17.49 billion in 2025 by IMARC Group, growing to $29.53 billion by 2034. DNA sequencing is Brazil’s most used technology, at 21.6% of biotech activity, and healthcare leads all applications, at 38.4% of the country’s biotech revenue.
Middle East & Africa:
Middle East and Africa also holds a 10% share of the global biotech market. Because both regions carry the same share, the dollar trajectory looks the same on paper, moving from around $0.18 trillion today to $0.65 trillion by 2035.
This growth is led by government backed diversification in the Gulf, not by a single dominant country the way Brazil leads Latin America. A separate regional breakdown from Invest Qatar puts the Middle East and Africa at $51.5 billion in 2025, rising to $125.9 billion by 2034 at a faster 10.5% CAGR, slightly above the global average. The UAE and Saudi Arabia are driving this, backed by initiatives like the UAE’s Operation 300Bn, which allocates AED 300 billion across strategic sectors including healthcare, and the wider GCC biotech market, projected by Knight Frank to reach $2.6 billion by 2028.
Biotechnology Market Size by Segment:
| Biotech Market By Segment | Percent (%) |
|---|---|
42% | |
Bio Industries |
24.25% |
Bio Agriculture |
20.86% |
Bio Services |
6.91% |
Bio Informatics |
5.99% |
Reference: Precedence Research Report.
Bio Pharmacy Market Size:
The biopharmaceutical market was valued at $758.87 billion in 2025 and is projected to reach $2,714.12 billion by 2035, growing at a CAGR of 13.59%. The bio pharmacy segment dominated the biotechnology market till date. This is because of the rising demand for biopharmaceuticals, driven by the growing prevalence of chronic diseases, such as cancer and autoimmune diseases. This segment has experienced exponential growth, driven by advancements in biotechnology, molecular biology, and personalized medicine. Its main offerings include monoclonal antibodies, vaccines, gene therapies, and regenerative medicines, which address a wide range of medical conditions.
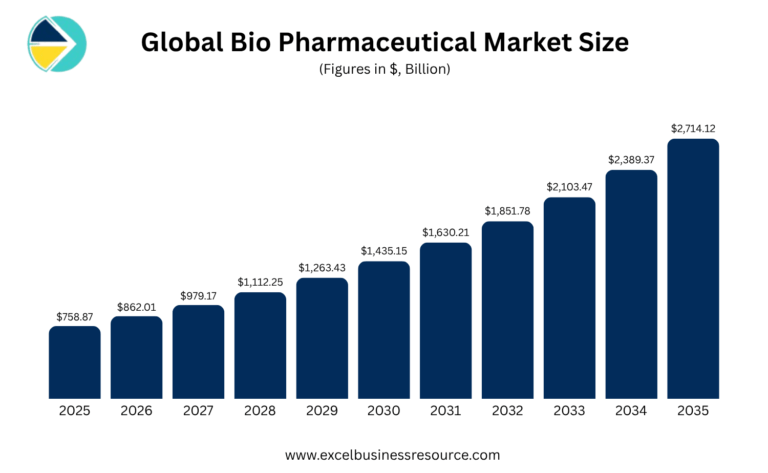
What this table tells you. Bio pharmacy roughly doubles every seven years on this trajectory. If your startup sits inside drug discovery, gene therapy, or diagnostics, you are competing for a slice of a segment that will add close to $2 trillion in fresh value over the next decade, but you are also competing against the deepest pocketed, most crowded part of the entire biotechnology industry.
Bio Industries Market Size:
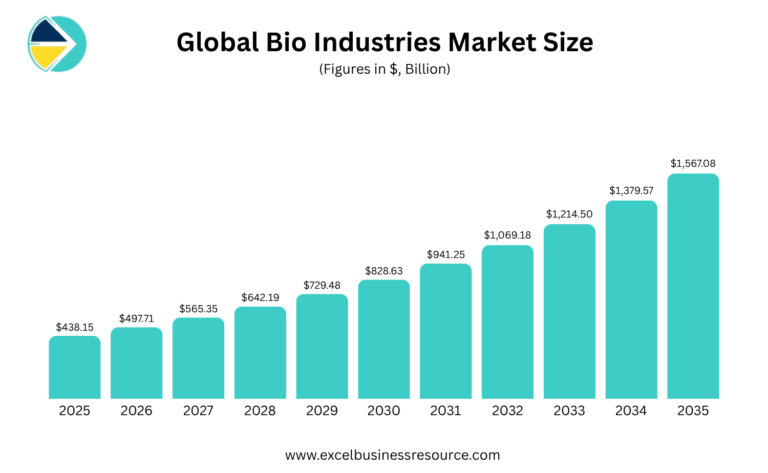
The bio industries market is valued at $438.15 billion in 2025 and is expected to reach $1567.08 billion by 2035, representing around a 13% CAGR.
This area uses biological processes to create materials, chemicals, and energy for everyday manufacturing.
- Biofuels. Refineries turning corn, algae, or plant waste into renewable fuel for cars and airplanes.
- Bioplastics. Businesses making eco friendly plastics from starch or sugarcane that naturally break down in soil.
- Industrial Enzymes. Chemical plants making biological enzymes used to remove stains in laundry detergent or to process food.
- Biomaterials. Brands engineering spider silk or lab grown leather for clothing and construction.
What this table tells you:
Bio Industries grows at a similar compounding pace to Bio Pharmacy but starts from a smaller base and carries none of the clinical trial risk that makes drug development so capital intensive. For a founder who wants biotech style growth without a decade long FDA pathway, this segment deserves a serious look.
Bio Agriculture:
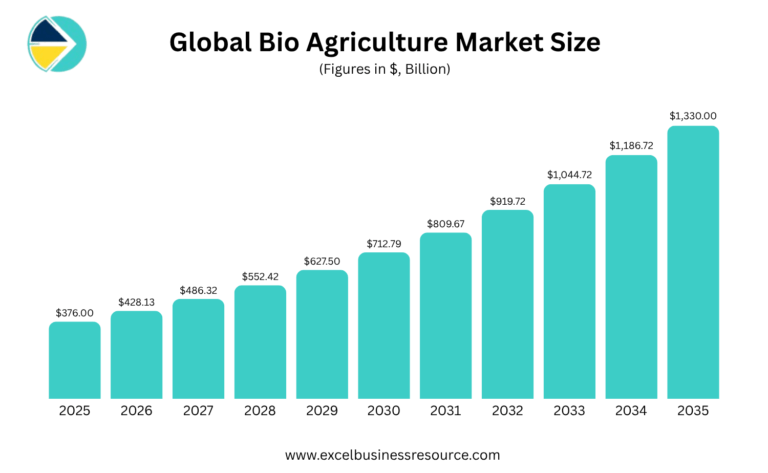
The bio agriculture market is valued at $376 billion in 2025 and is expected to reach $1340 billion by 2035, representing a 13% CAGR.
The bio agriculture segment is expected to grow at a notable rate in the upcoming period, due to the rising focus on improving food products. Increasing demand for food, demand for natural ingredients, and the need to protect the environment are driving the bio agriculture segment. Growing government support through subsidies and policy incentives, along with increasing awareness of soil health and sustainability, is fostering demand for biofertilizers, biopesticides, and transgenic crop varieties.
Bio Services:
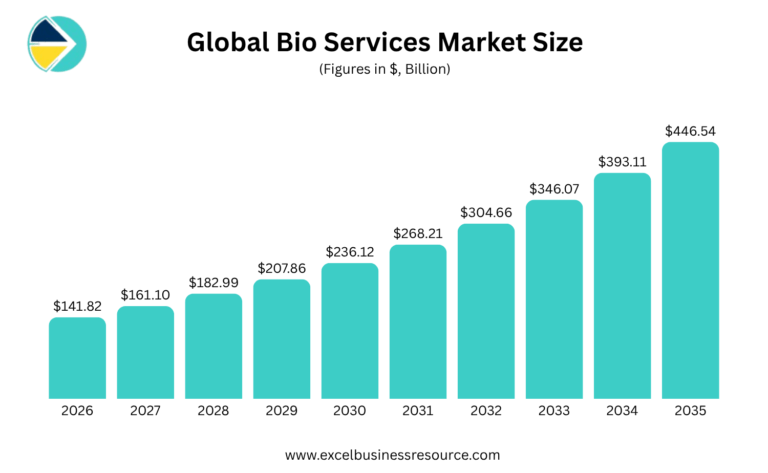
The market is projected to grow steadily from $124.85 billion in 2025 to $446.54 billion by 2035. By 2030, it is expected to reach $236.12 billion, nearly doubling from its 2025 level. Over the full 2025–2035 period, the market would expand by approximately 258%, adding more than $321 billion in market value. The consistent year-over-year increase indicates a strong compounding growth trajectory throughout the forecast period.
These are specialized helper businesses that offer technical support to other biotechnology companies.
- Contract Research Organizations (CROs). Specialized labs that other companies hire to run safe clinical trials on new drugs.
- Contract Manufacturing (CMOs). Large production plants that brew, bottle, and pack biological products for smaller brands.
- Equipment Supply. Businesses that design and sell heavy laboratory machinery like bioreactors or microscopes.
What this table tells you:
Bio Services is the smallest segment in absolute dollars, but it is arguably the safest place to build a biotech adjacent company. CROs and CMOs earn revenue whether or not any individual drug candidate succeeds, since they are paid for the service, not for the outcome of the science.
Bio Informatics:
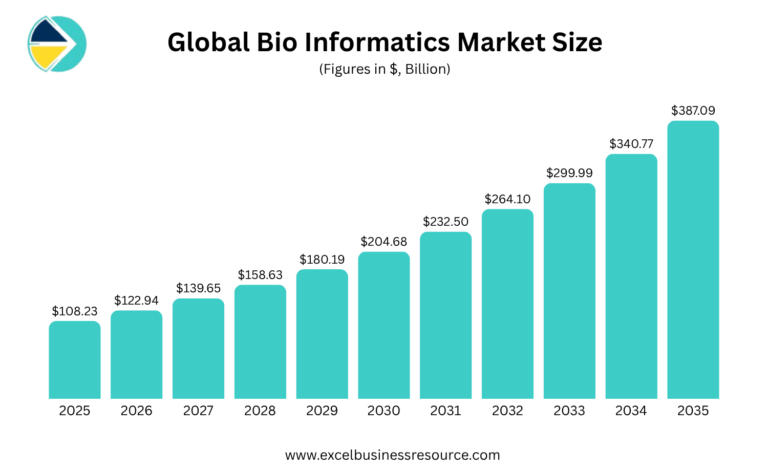
The bioinformatics market is projected to expand from $108.23 billion in 2025 to $387.09 billion by 2035, representing approximately 258% growth over the forecast period. The strong expansion reflects rising demand for genomic data analysis, AI-driven bioinformatics, precision medicine, and computational tools for drug discovery.
How Big Is the US Biotechnology Market?
The US biotechnology market size was valued at $0.85 trillion in 2025 and is anticipated to reach around $3.23 trillion by 2035, growing at a CAGR of 14.28% from 2026 to 2035.
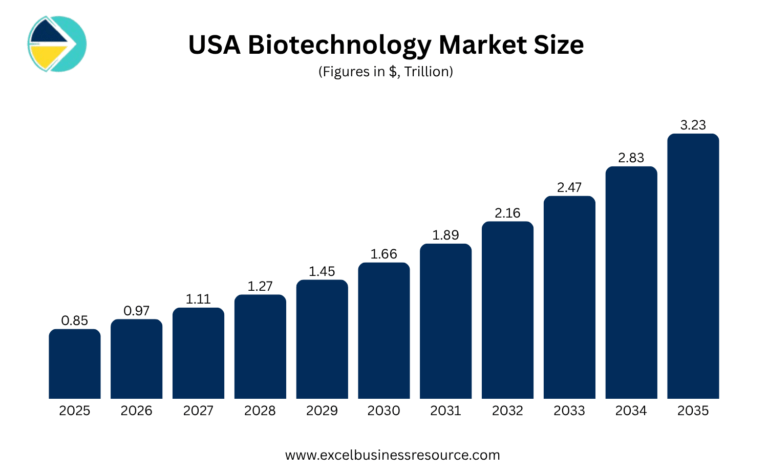
North America, particularly the United States, dominates the global biotechnology market due to its robust R&D infrastructure, high healthcare expenditure, and well established regulatory environment. The US is home to biotech giants like Amgen, Gilead, and Biogen, as well as thousands of startups funded by a vibrant venture capital ecosystem. Federal initiatives like the NIH, BARDA, and the National Cancer Institute fund significant biotech research. The region also benefits from top tier academic institutions and biotech clusters in Boston, San Francisco, and San Diego. Regulatory support from the FDA’s Breakthrough Therapy Designation and Accelerated Approval pathways has fueled innovation and market access.
Why the US grows faster than the global average:
Notice that the US CAGR of 14.28% actually outpaces EBR’s global CAGR of 13.6%. That is unusual for the largest market in any industry, since bigger markets typically grow slower than smaller, earlier stage ones. The explanation sits in the data above: US venture capital alone deployed $33.8 billion into biopharma in 2025, more than the entire Middle East and Africa region’s total market size that same year. Scale and speed are compounding together inside the US market in a way that is genuinely rare.
Biotech Market Dynamics
What Is Driving Biotech Market Growth?
- Rising adoption of personalized and targeted therapies, cited by 61% of biopharma industry respondents as the leading positive growth trend in a recent GlobalData survey
- AI integration across drug discovery, spanning target identification, molecule design, and clinical trial matching, with the global AI in biotechnology market alone projected to grow from $3.89 billion in 2025 to $22.23 billion by 2035
- Expanding CRISPR based gene editing and mRNA platforms, moving from proof of concept into durable commercial products
- A genuinely aging global population. The number of people aged 80 or older is projected to triple between 2019 and 2050, from 143 million to 426 million, directly expanding the patient pool for age related disease treatments
- Growing chronic disease burden, especially cancer, rare disease, cardiovascular conditions, and metabolic disorders such as diabetes and obesity
- Government backed manufacturing funds, such as the UK’s Life Sciences Innovative Manufacturing Fund and Germany’s High Tech Gründerfonds, which de risk early stage domestic production
- Expansion of biotechnology beyond healthcare into agriculture, industrial processing, and environmental applications, opening entirely new revenue categories outside traditional biopharma, as shown by the Bio Industries and Bio Agriculture data above
- China’s growing role as a source of licensed innovation, with Western biopharma increasingly forming alliances with Chinese biotechs rather than only acquiring US or European assets.
What Is Holding the Biotech Market Back?
Growth drivers explain why the market is expanding. Restraints explain why it is not expanding even faster, and they are structural rather than temporary.
- Extremely long development timelines. A single drug can take ten to fifteen years to move from discovery to approval, which ties up capital for far longer than almost any other startup sector.
- High and rising development costs. Recent Deloitte analysis puts the average cost of bringing a single approved drug to market at $2.3 billion, a figure that keeps climbing as clinical trials grow larger and more complex.
- Strict, fragmented regulation. A therapy approved by the FDA still needs separate review from the EMA in Europe, the NMPA in China, and other national bodies, multiplying the compliance burden for any company that wants to sell globally.
- Ethical and public trust concerns. Gene editing, genetically modified organisms, and AI driven drug design all face recurring public skepticism that can slow adoption even after a technology is proven safe.
- Talent concentration in a handful of hubs. Deep biotech expertise remains clustered in a small number of cities such as Boston, San Francisco, Cambridge, and Shanghai, which limits how quickly new hubs elsewhere can scale.
What Challenges Does the Biotech Industry Face?
No growth story is free of friction, and this sector has real headwinds right now.
- The patent cliff. More than 40% of big pharma revenue is at risk from patent expirations in the next six years, according to a Stifel biotech outlook, and Evaluate frames the total exposure near $300 billion. This is forcing large pharma companies to replace revenue through licensing and acquisition rather than organic growth alone.
- Financing concentration. Venture capital is consolidating into fewer, larger deals, leaving many early stage companies facing a longer road to their next round. Investors have also set higher benchmarks for clinical data readouts before committing capital.
- A slow but recovering IPO market. The IPO market declined sharply from 2021’s high water mark, though early 2026 offerings and mega rounds such as Earendil Labs raising $787 million in March 2026 suggest the window is reopening for well positioned companies.
- High development costs and regulatory complexity. Long clinical timelines and strict FDA or EMA approval pathways keep capital requirements high for years before any revenue appears.
- Industry bifurcation. Companies with differentiated, late stage assets are advancing quickly, while early stage innovators without strong data are struggling to secure funding at all. This gap is widening, not narrowing, heading into the second half of 2026.
- Policy and tariff exposure. US tariffs, drug pricing pressure, and funding cuts to agencies such as the NIH were identified among the largest negative trends facing the industry in a recent global biopharma outlook survey.
How Is AI Changing the Biotechnology Industry?
Artificial intelligence has moved from a side project inside biotech to a core part of how new drugs get discovered and developed. In 2025, Rentosertib became the first fully AI designed and AI discovered drug to complete Phase IIa trials, improving lung function in idiopathic pulmonary fibrosis patients where the placebo group saw a decline. That single result did more to prove AI’s real world value in biotech than any market report could.
The scale of the shift shows up in the numbers too. Recursion Pharmaceuticals has demonstrated it can synthesize nearly 330 compounds per program in 17 months, compared with an industry average of 2,500 compounds over 42 months, dramatically compressing the timeline that used to define early drug discovery. Eli Lilly’s TuneLab platform, launched in September 2025, now lets external partners access AI drug discovery models directly, a sign that even the largest legacy pharma companies see AI infrastructure as something to license out rather than keep entirely proprietary.
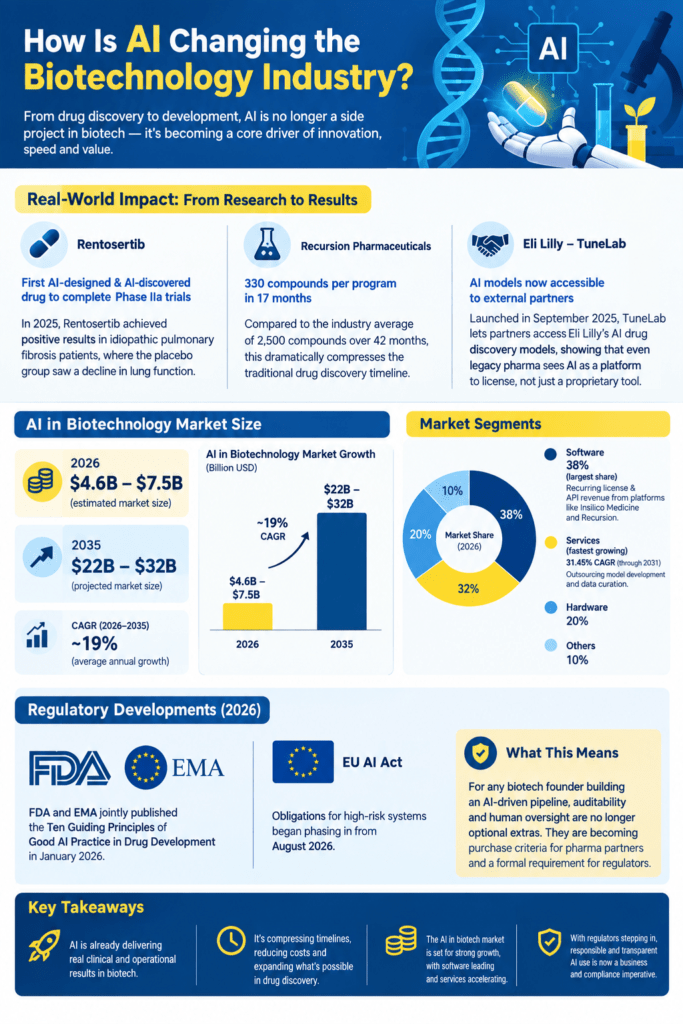
Analysts size the AI in biotechnology market itself at somewhere between $4.6 billion and $7.5 billion in 2026 depending on scope, growing at roughly 19% a year to reach $22 billion to $32 billion by 2035. Software currently holds the largest share of that market at around 38%, built on recurring license and API revenue from platforms like those run by Insilico Medicine and Recursion. Services are the fastest growing piece, expected to post a 31.45% CAGR through 2031, as more drug manufacturers choose to outsource model development and data curation rather than build these capabilities in house.
Regulators have started catching up in 2026. The FDA and EMA jointly published ten Guiding Principles of Good AI Practice in Drug Development in January 2026, and EU AI Act obligations for high risk systems began phasing in from August 2026. For any biotech founder building an AI driven pipeline, auditability and human oversight are no longer optional extras. They are becoming purchase criteria for pharma partners and a formal requirement for regulators.
How VCs Evaluate Biotech Startup At Each Stage?
Biotech does not raise money the way SaaS or consumer startups do, and treating it that way is one of the fastest ways for a founder to misjudge a term sheet.
Biotech valuation runs on science, not revenue:
Most biotech startups have no product revenue for years, sometimes a decade. Investors instead value the company using risk adjusted net present value, which weighs future cash flows by the probability that a drug candidate actually survives each clinical trial phase. Since Biotech startups are at risk all the time, therefore VCs use highest hurdle rate from around 40% for preclinical assets down to 15% for late stage trials, averaging near 19% overall. VCs also analyze comparable company valuation and sum of the parts valuation, where each pipeline asset is valued separately, are the other two methods you will see most often.
Moreover, there are many funding strategies for biotech founders which founders can choose according to their biotech startup revenue model.
Here is what that translates to in real numbers.
| Stage | Typical Raise | Typical Valuation | What Investors Expect to See |
|---|---|---|---|
Pre Seed |
$250K to $1.5M |
$5M to $10M |
A credible scientific thesis and founding team, often preclinical |
Seed |
$1.5M to $6M |
$10M to $25M |
Early preclinical data, IP filed, a clear path to Phase 1 |
Series A |
$10M to $25M |
Average around $79.4M |
A median revenue multiple near 6.2x for biotech and genomics companies, tied to pipeline strength and regulatory progress. |
Series B |
$20M to $60M |
Often above $150M for strong data |
Positive Phase 2 or early Phase 3 results, strategic pharma partnerships |
Series C and beyond |
$30M to $100M+ |
Case by case, tied to late stage trial outcomes |
Near term regulatory approval, commercialization readiness |
If you are analyzing cost to build biotech startup, & building a budgeting than remember one number: bringing a single drug to market costs $2.3 billion on average, according to recent Deloitte analysis.
For fundraising, the rule is different. You should not raise money on a fixed calendar, like every 12 months. Instead, tie each round to a specific milestone, such as a Phase 1 result or a regulatory approval. This is called milestone based fundraising, and it is now the standard approach across the industry. The reason is simple: it keeps your dilution lower, and it gives investors a clear that their foundations & key metrics are strong, concrete reason to invest at each stage, not just a promise.
Understand top 10 biotech key metrics to track to get funding.
At this stage, forecast your biotech trails success rate, costing, & link to revenue forecast. Do some excel exercises & prepare forecasting revenue since biotech revenue depends in trails success rate.
This article will help you in how to forecast biotech revenue.
What Should Founders and Investors Take Away From This Data?
Here is the analysis that most market reports leave out.
- Scope your pitch to the right number. If you cite a nine trillion dollar biotech market in a pitch deck without noting the scope, an informed investor will question your diligence before they question your science. EBR’s own base case of $1.81 trillion for 2025 sits deliberately in the middle of the published range for exactly this reason. Use a defensible range, not a single cherry picked figure.
- Capital is available, but it is selective. The $33.8 billion raised globally in biopharma VC funding in 2025 proves money exists and is growing again for a second straight year. The concentration into fewer, larger rounds proves it is harder to access unless your data package is strong. Build your financial model and clinical milestones before you approach investors, not after.
- Niche segments may beat the flagship segment. Bio pharmacy is the biggest slice of the pie at $758.87 billion in 2025, but bioinformatics and nanobiotechnology are growing faster from a smaller base, often with lower capital intensity and shorter paths to revenue.
- Geography changes your competitive set. A founder building in Asia Pacific is entering the fastest growing region in the world, with China’s licensing deal value already exceeding $56 billion in the first quarter of 2026 alone, but also one where government backed manufacturers are scaling fast. A founder in North America competes in the biggest pool but also the most saturated one.
- The patent cliff is an opportunity, not just a risk. Big pharma companies need to refill pipelines ahead of roughly $300 billion in exposed patent value. That means licensing deals, acquisitions, and partnerships are actively being sought right now, which is good news if your startup has a de risked, late stage asset to offer.
If you are building your own biotech venture and need to translate any of this market data into an investor ready model, our Biotech Financial Model and Valuation Template is built specifically for 30 year drug development timelines, R&D cost planning, and milestone based valuation. You can also browse our full Healthcare and Life Science Financial Model library if your venture spans clinics, diagnostics, or medical devices alongside biotech.
Frequently Asked Questions (FAQs)
What is the biotechnology market size in 2026?
EBR’s own estimate places the global biotechnology market at $1.81 trillion in 2025, growing toward $6.46 trillion by 2035 at a 13.6% CAGR. Depending on scope, other major research firms place 2026 estimates anywhere between roughly $1.5 trillion and $2.8 trillion.
What is the growth rate of the biotech industry?
Most major reports, including EBR’s own estimate, place the compound annual growth rate between 12.5% and 14.3% through 2034 or 2035, several times faster than global GDP growth.
Which region has the largest biotech market share?
North America, with 35% of global revenue according to EBR’s regional breakdown, largely due to the United States, which alone accounts for $0.85 trillion in 2025 revenue.
Which region is growing the fastest in biotech?
Asia Pacific. While it holds a 20% market share today, China’s biopharmaceutical out licensing deals alone reached $137.7 billion in 2025 and were already at $56.7 billion in the first quarter of 2026, evidence of a region growing faster than its current share reflects.
What is the biggest application segment in biotechnology?
Bio Pharmacy, valued at $758.87 billion in 2025 and projected to reach $2.71 trillion by 2035, driven by monoclonal antibodies, vaccines, gene therapies, and regenerative medicine.
Which biotech segment is growing the fastest?
Bioinformatics, at a 13.2% CAGR, closely tied to the even faster growing AI in biotechnology market, projected to grow at roughly 19% a year through 2035.
How much funding does a biotech startup need at each stage?
Pre seed rounds typically raise $250K to $1.5M at a $5M to $10M valuation. Series A rounds average around $79.4M in valuation with a median 6.2x revenue multiple. Strong Series B rounds with positive Phase 2 data often exceed $150M in valuation.
What is the biggest challenge facing biotech companies in 2026?
Financing concentration and the approaching patent cliff, which is pushing over 40% of big pharma revenue toward exposure from expiring patents within six years.
Final Thought:
Biotech is one of the few industries growing faster than five times global GDP while still facing a genuine funding squeeze at the early stage. That gap between opportunity and access is exactly where a strong financial model, a clear market narrative, and accurate data separate the startups that raise capital from the ones that stall.
This is exactly where EBR comes in. Our team builds business plans specifically for biotech startups, covering market research, data analysis, financial projection modeling, and ongoing bookkeeping. We do not just hand you a template. We help you turn a complex, long timeline industry like biotech into a clear, investor ready story backed by real numbers.