
Startup booted financial modeling means building your forecast around the cash you actually have, not the cash you hope an investor will add as equity finance in next quarter or year. When you fund the company yourself, every dollar has a job, and a good model excel shows which job comes first. This guide explains how the process works, what goes inside the model, and how pre-revenue founders can build excel financial model without historical data.
Quick answer: A startup booted financial model is a bootstrapped startup financial model that links your P&L, balance sheet, and cash flow statement. It shows your monthly net burn, your runway, and your zero cash date, so you can grow without giving up equity too early.
What Is Startup Booted Financial Modeling?
Bootstrapped startup financial modeling is a cash driven way of forecasting. You start with the money in the bank, add expected inflows, subtract outflows, and see how long the business survives under different conditions.
If startup founder build financial model for VC, so it’s model purpose is to, “How fast can we grow if we raise $3 million?”. But if a founder build forecasting model for bootstrapping, then it’s purpose is to, “How far can we get on what we have, and what must happen before we run dry?”
How Does Bootstrapping Financial Model Differ From A VC Ready Financial Model?
| Comparison point | Bootstrapped model | VC backed model |
|---|---|---|
|
Core question |
How long can we last? |
How big can we get? |
|
Main priority |
Cash preservation and profit |
Growth and market share |
|
Hiring approach |
Hire after revenue arrives |
Hire ahead of revenue |
|
Key success metric |
Runway and contribution margin |
Growth rate and next round |
|
Role of equity |
Protected as long as possible |
Traded for capital |
The math is the same. The questions you ask of it are different.
Pro Tip: If raising capital becomes essential, mastering a startup booted fundraising strategy allows you to secure investment while preserving maximum founder equity.
Why Bootstrapped Startups Need a 3 Statement Financial Model
Many founders track cash in a simple sheet and call it a model. That works fine in the early days—until operational growth turns static lines into interdependent variables.
When you’re self-funded, you don’t have investor capital to cushion cash flow miscalculations. A single hiring decision ripples through your business: your P&L absorbs the salary expense, your Cash Flow Statement tracks the actual payout dates, and your Balance Sheet reflects your shrinking runway and working capital. A basic cash sheet completely misses these timing gaps and in bootstrapping, timing gaps are fatal.
CB Insights found that 38% of startup failures stem from running out of cash or failing to raise capital. For bootstrapped founders who rely entirely on cash flow reinvestment, precision isn’t optional it’s your primary survival mechanism. A dynamic 3-statement model connects these moving parts so you can see the ripple effects of every operational decision before committing real cash.
Read article on the crucial role of financial modeling in startup success covers the wider case.
The Building Blocks of a Financial Model for Bootstrapped Startups
A strong financial model has six parts. Keep each one simple.
- Business driver assumptions: Build business assumptions or factors that drive your business e.g. from leads, conversion rate, average order value, churn, pricing, and product cost not from a guess like “we will make $200,000.” Our guide to business drivers for startups shows how to pick them.
- COGS breakdown: Separate what it costs to deliver each sale, such as hosting, materials, payment fees, and fulfillment. This gives you true gross margin.
- OpEx forecasting: List salaries, software, rent, and marketing. Use zero based budgeting for early stage startups: every expense starts at zero each quarter and must earn its place.
- Capex schedule and depreciation: Equipment hits cash on day one but hits profit slowly through depreciation. Model both.
- Working capital and accounts receivable timing: Revenue is not cash until the customer pays (more below).
- Funding and debt: If you use a loan or revenue based financing, track the debt service coverage ratio (DSCR). Lenders generally want operating income comfortably above debt payments.
Profit Vs Cash: Why Timing Matters
Suppose you invoice a client $10,000 in March on 45 day terms. Your March P&L shows $10,000 of revenue. Your bank balance shows nothing until mid April. Meanwhile, you paid $6,000 in salaries and supplier bills in March.
You are profitable on paper by $4,000 and short $6,000 in cash. A three statement model catches this gap. A profit only forecast does not.
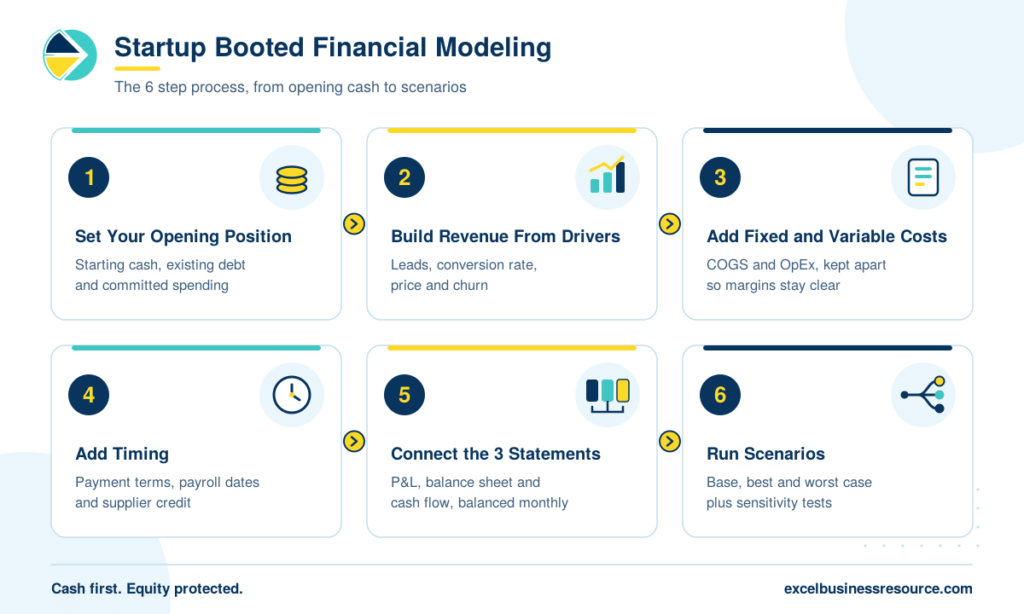
How Bootstrapped Startup Financial Modeling Works
This is the process we follow with clients at Excel Business Resource.
- Set your opening position. Record starting cash, existing debt, and committed spending.
- Build revenue from drivers. Link each revenue line to an input you can test.
- Add direct and operating costs. Tie variable costs to sales volume and keep fixed costs separate.
- Add timing. Apply payment terms, payroll dates, and supplier credit.
- Connect the three statements. Make sure the balance sheet balances every month.
- Run scenarios. Create base, best, and worst cases, then stress test the assumptions that worry you most.
For the full mechanics of a general forecast, see our guide to build a startup financial forecasting model. This article stays focused on cash first and equity protected.
How to Forecast Cash Runway Without Historical Data
Pre revenue founders often say, “I have no data, so I cannot forecast.” But you do have data for instance, prices, supplier quotes, salary offers, and benchmarks from similar businesses.
Start with two formulas:
- Monthly net burn rate = cash going out minus cash coming in
- Runway = cash in the bank divided by monthly net burn
Say you have $60,000 in cash, spend $11,000 a month, and earn $5,000. Net burn is $6,000, so runway is 10 months. That is your zero cash date: the month your balance hits zero if nothing changes.
Free Startup Financial Runway & Burn Rate Template
Download free excel spreadsheet to track monthly burn rate, calculate runway, and model scenario planning for your startup.
Test the date with scenario analysis (base, best, worst case)
The real value comes from changing one driver at a time. Using the same starting point ($60,000 cash, $11,000 monthly costs, $5,000 starting revenue), here is how monthly revenue growth changes the outcome:
| Scenario | Monthly Revenue Growth | Cash Breakeven Month | Lowest Cash Balance | Zero Cash Date |
|---|---|---|---|---|
|
Worst case |
0% (flat sales) |
Never |
$0 |
Month 10 |
|
Base case |
10% |
Month 10 |
About $28,900 |
Not reached |
|
Best case |
15% |
Month 7 |
About $37,800 |
Not reached |
Illustrative figures, calculated on the assumptions above. Costs are held flat for simplicity.
Look at the gap between worst and base. Five points of extra growth is not the difference between fine and great. It is the difference between running out of cash and surviving with half your cushion left. That is bootstrapped runway expansion modeling at work, you find which lever buys the most time, whether that is pricing, collections, or a cost cut.
Add sensitivity analysis tables to see how runway shifts when two inputs move together, such as conversion rate and CAC. For more spreadsheet techniques, see these Excel hacks for revenue forecasting.
Cash preservation vs burn rate strategy
Burn rate tells you how fast you spend. Cash preservation tells you what you protect first. Decide in advance which costs you cut first (usually ads and tools), which you protect (product and support), and at what cash level each decision triggers. Write those triggers into the model so you never decide in a panic.
Validate Unit Economics Before You Spend
Unit economics validation stops a small budget from leaking into channels that never pay back. Track these monthly:
- Customer acquisition cost (CAC) payback period: CAC divided by monthly gross profit per customer
- Lifetime value (LTV) to CAC ratio: Gross profit over a customer’s life divided by CAC
- Contribution margin percentage: Revenue minus all variable costs, as a share of revenue
- Monthly recurring revenue (MRR) gross margin: MRR minus the cost to serve it
Investor David Skok popularized two SaaS benchmarks,
- LTV at least three times CAC.
- CAC recovered within 12 months.
Treat them as rules of thumb. A services business with thin margins needs different targets.
Quick check: A customer pays $100 a month, gross margin is 80%, and monthly churn is 4%. LTV is $100 × 0.80 ÷ 0.04 = $2,000. With CAC at $500, your ratio is 4:1 and payback is about six months. That channel deserves more budget. At $1,500 CAC, you pause and fix something first.
Go deeper with our posts on unit economics and startup valuation and driver based forecasting.
Five Mistakes That Break Bootstrapped Models
- Treating revenue as cash. Always model payment delays.
- Using one growth rate for all 12 months. Early growth is lumpy, so use monthly inputs.
- Forgetting one time costs. Annual software fees, taxes, and legal costs hit cash in single months.
- Skipping the worst case. If you have never seen your worst case, you cannot plan for it.
- Never updating with actuals. A model that is not compared with real results slowly becomes fiction.
How Your Financial Model Helps You Protect Equity
Buy Time, Build Leverage
Every extra month of runway is pure negotiating power. A founder with 14 months of cash approaches investors from a position of strength unlike one with only 3 months. A clear financial model allows you to raise capital on your own timeline, for the exact amount you need, and at a valuation you can confidently defend.
Deliver Investor-Ready Projections
When you decide to raise, your model provides exactly what investors want to see: clear, driver-based financial projections that you can explain with confidence.
Prove Your Valuation & Profitability
Beyond projections, a solid model demonstrates your path to profitability and key financial metrics like EBITDA. Whether you are forecasting cash flow or evaluating startup valuation, a well-structured model gives investors the clarity they need to back your vision.
Read in details: why EBITDA matters for startup valuation & How to do startup valuation with 8 different methods
DIY, Template, or Consultant?
- Build it yourself: Lowest cash cost, highest time cost. Works if you know Excel and accounting basics.
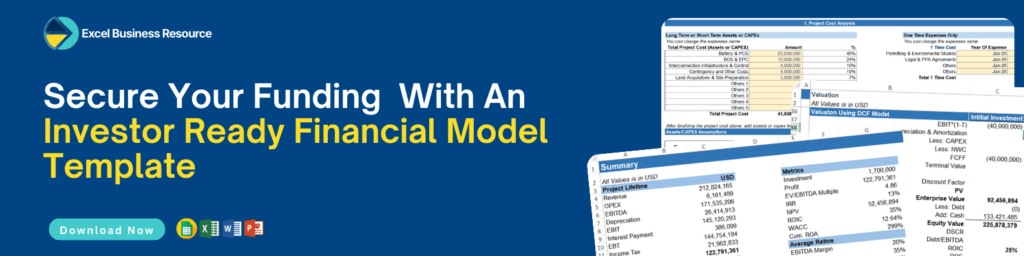
- Use a read to use template: A tested investor ready templates saves weeks and reduces formula errors. Browse our investor ready financial model templates.
- Hire a consultant: Smart when your business is complex, you are preparing for a raise or loan, and a mistake would cost more than the fee. See our custom financial modeling services and how FP&A helps scale startups.
If you want free ready to use template to start with, then download the following according to need.
Final Thoughts
Startup booted financial modeling gives you control. You know your runway, your breakeven point, and the metrics that matter before you spend. Start simple, test it against real numbers each month, and keep improving it.
At Excel Business Resource, we have worked with 100+ startups on financial modeling, FP&A, and data analysis. Explore our templates or talk to us about a custom build.
FAQs
How does financial modeling for a bootstrapped startup differ from a VC backed startup?
A bootstrapped model is built around cash, profit, and runway. A VC backed model is built around growth and the next funding round. Bootstrapped founders hire after revenue arrives, while VC backed teams often hire ahead of it.
What are the core revenue drivers to include in a startup booted financial model?
Include the inputs that move sales: traffic or leads, conversion rate, average order value or price per customer, purchase frequency, churn, and sales cycle length. Add seasonality if your business has it.
How do you accurately forecast cash runway without historical data?
Use supplier quotes, competitor pricing, industry benchmarks, and your own cost commitments. Build three scenarios, then calculate net burn and the zero cash date for each. Update the model monthly with actuals.
Why do bootstrapped startups need a 3 statement financial model?
The three statements show how profit, assets, and cash connect. Without them, you can look profitable while running out of cash because of slow customer payments, inventory, or equipment purchases.